After modification tests
Here are some tests made with the RTX 6001 right now -
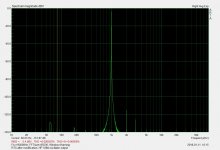
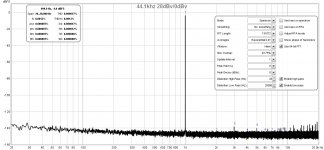
The output channel is at 1 V and the receivers set to 10 dBV.
-Chris
Here are some tests made with the RTX 6001 right now -
The output channel is at 1 V and the receivers set to 10 dBV.
-Chris
Attachments
Normally you will see a lower THD if you:
Set the output attenuator to 20 dBV and the output level to -20 dBFS
than if you:
Set the output attenuator to 0 dBV and the output level to 0 dBFS.
Both will give you 1 Vrms balanced, but the THD will be lower with the first setup.
Generally it is relevant to know:
1. The output attenuator setting
2. The output level in dBFS
3. The input attenuator setting
What are you planning to test with your RTX? Or what have you tested?
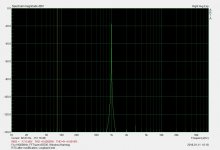
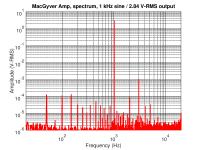
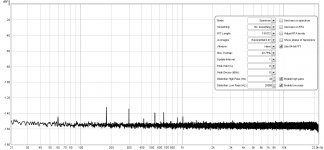
Here's one of my measurements using the RTX on my current tube amp project. I would like the mains related peaks a bit lower (50 Hz, 100 Hz, 150 Hz, etc.). These peaks go much lower if the RTX output is disconnected from the amp, and the amp input is shortened, thus measuring the amp's self noise only. Do I have a ground loop in the test setup?
Attachments
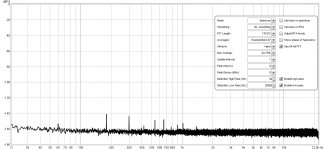
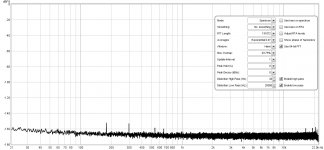
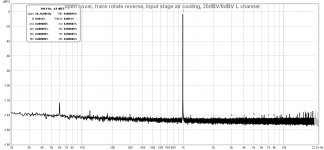
I found RTX6001 can have a pretty decent THD in the loopback measurement, if the transformer is upside down and rotated to make the wire-output facing to the opposite direction of the main PCB. It also reduces the harmonics of 60Hz for the -20/-10/0dBV inputs dramatically. Forced air cooling helps to reduce the 3rd harmonic in the 1K sine THD test and keeps the THD value between 0.000018% and 0.000020%, an extremely stable reading.
That's quite good. Do you have before measurements? Which change made the largest improvement?
Hi Jens,
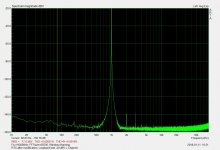
I think this is how you wanted it set up, here are the loopback tests. Please let me know if you want anything else, or if it isn't what you expected.
-Chris
I think this is how you wanted it set up, here are the loopback tests. Please let me know if you want anything else, or if it isn't what you expected.
-Chris
Attachments
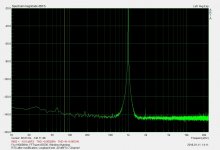
You should probably try to increase the FFT window size. With a 64k FFT a lot of what's included as harmonics is in reality the noise floor. The second harmonic seems to be around -123 to -126 below the fundamental. The other harmonics are more or less buried in the noise floor.
Do you connect the output of the amplifier differentially to the analyzer input?
And what about the shield of the cable to analyzer input?
Yes, I use the XLR output of the RTX ("XLR pos" to amplifier audio input, "XLR neg" to amplifier signal-GND).
I have tried connecting the XLR shield/chassis to the amp chassis, but this made no difference to the mains related peaks.
The amplifier has a ground loop breaker to separate the audio-GND from chassis/safety-earth.
Anyone running ARTA with the RTX-6001?
Hi Jens,
Let's hope someone can run your tests and report on what they find.
Jens, if you can add to this if there is anything you want that is missing
Best, Chris
Hi Jens,
Let's hope someone can run your tests and report on what they find.
Then it would be really helpful to do the following and post the screen captures ... please someone ...You can of course still get overload/overflow. If you set it to the -20 dBV position, a sine wave signal above 100 mV will give you an overflow.
The add-on board is related to the overvoltage protection, which is something entirely different.
The way I normally test the overvoltage protection and modification is as follows:
Set the input attenuator to the 10 dBV setting.
Set the inputs to DC (not AC).
Take a lab power supply or similar and set it to around 10 V.
Connect a 1 k resistor in series with one of the supply leads (just in case something should be wrong).
Connect the wires, with the resistor in series, between chassis (e.g. the 4 mm plug) and (one at a time):
Pin 2 of the XLR input left
Pin 3 of the XLR input left
Pin 2 of the XLR input right
Pin 3 of the XLR input right
Check that you can hear a relay clicking in the analyzer each time you connect to an input pin.
Repeat for the opposite polarity.
Now set the inputs to the 20 dBV range.
Repeat the tests above and check that no relays are clicking
If this is OK you could test it further by:
Setting the inputs to the 30 dBV range.
Apply a signal of e.g. 20 V rms balanced to each input. The distortion should be low (at least if you are using a low distortion generator ). I normally use a Stanford Research DS360 and get THD levels of around - 112 to -114 dB.
If you don't have a balanced source, you could also apply a level of 10 Vrms to each of the input signal pins (2 and 3, one at a time) for each channel.
If the modification has not been done, you will see increased distortion when you get above around 6 - 7 Vrms.
Set the output attenuator to 20 dBV and the output level to -20 dBFS
than if you:
Set the output attenuator to 0 dBV and the output level to 0 dBFS.
Both will give you 1 Vrms balanced, but the THD will be lower with the first setup.
Generally it is relevant to know:
1. The output attenuator setting
2. The output level in dBFS
3. The input attenuator setting
Jens, if you can add to this if there is anything you want that is missing
Best, Chris
Hi Chris
Try REW and Audio Tester
I have found Spectra Plus SC is really good but expensive
REW and Wavespectra are free
They also work well
You have to correctly set Asio otherwise even REW was showing noise floor not that low
I’m yet to evaluate HPW - seems pretty solid with FFT
Try REW and Audio Tester
I have found Spectra Plus SC is really good but expensive
REW and Wavespectra are free
They also work well
You have to correctly set Asio otherwise even REW was showing noise floor not that low
I’m yet to evaluate HPW - seems pretty solid with FFT
I have a QA190 and a Micsig DP10013. <snip>
Do you have a similar measurement, after the modification?
Interesting,
Are harmonics really there? I would suspect that they are.
Why did they go away using the differential probe? Is there something going in the voltage divider between the probe output impedance and the analyzer input impedance?
I like the idea of a 10:1 or 100:1 probe to use testing higher voltages.
DT
Hi kannan_s,
-Chris
Edit: For the money, I sure hope you can at some point in the near future!
I have the shareware version of Audio Tester loaded but don't really know how to use it yet. I just installed it.Try REW and Audio Tester
I have found Spectra Plus SC is really good but expensive
REW and Wavespectra are free
They also work well
That isn't a problem, it is running fine. ARTA uses it as well. That installation was painless (thank you Jens & RTX).You have to correctly set Asio otherwise even REW was showing noise floor not that low
-Chris
Edit: For the money, I sure hope you can at some point in the near future!
That's quite good. Do you have before measurements? Which change made the largest improvement?
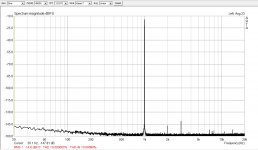
Attached are the before measurements.
Each change made an improvement in some aspects, but not for all aspects.
Sometimes it's a deterioration in some aspects.
The best setup for now is to make the transformer upside-down and rotate it a bit, and slide 2~3 sheets SPTE steels covered with aluminum foil, into the top cover of RTX6001.
I also attached the measurement with top cover opened, and using my hairdryer to cool down my unit. It can be seen that the 60Hz peak is quite strong without top cover installed, but the THD is very low and stable with the cooling air.
BTW, any modification may void the warranty. If you also want to try the above-mentioned setup, it's at your own risk.
Attachments
Last edited:
Interesting,<snip>
Those harmonics were due to the problems with the voltage sensing circuitry on the RTX that the repair boards were shipped for. This is why people are modifying the units or sending them back to be fixed.
Dear Chris,
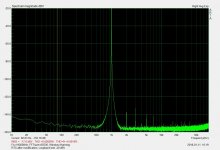
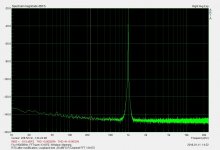
There is something fishy with your spectra.. I think You are using non-appropriate windowing. For this you get that broadening. Try Kaiser 7 window, linear averaging.
64 bit FFT.
All these also get into the numbers..
Ciao, George
There is something fishy with your spectra.. I think You are using non-appropriate windowing. For this you get that broadening. Try Kaiser 7 window, linear averaging.
64 bit FFT.
All these also get into the numbers..
Ciao, George
Attachments
- Status
- Not open for further replies.
- Home
- Group Buys
- GB for RTX6001 Audio Analyzer with AK5394A and AK4490