You are correct about current drive for WT2 vs non current drive for WT3.
The reason I say a copy is that we can create a version of WT2 software that runs on the WT3. The results are horrible but the h/w guts are 95% the same. Similarly WT3 s/w running on a WT2 creates horrible results.
The WT3 I have returns large errors in Qts with the h/w emulator I constructed. It is possible there are setting amiss but did not get any instructions with the WT3 so I did not pursue the issue. The h/w emulator measured by the WT2 had less than 1% error.
The only thing that is a copy is the name. WT2 iteratively probes the DUT to obtain the key data directly to derive T/S. WT3 runs an impedance sweep and then tries to derive the T/S indirectly from that.
WT2 HW has a built in current amp, not so sure about WT3
dave
Yes Win 7 and Win 8. Every time MS comes out with a new OS the WT2 s/w is updated.
The latest version auto-detects the OS and sets up the s/w to run correctly. Earlier versions required some tweaking of audio mixer settings based on OS.
s/w downloads are free. Last I checked, WT3 charges for software updates.
This is great news. Please consider updating the website, I'd hate to see you lose sales over this. I know you have great support but some people simply won't bother to ask.
Yes, WT3 does charge for software updates, only one of the many reasons I'd like to avoid a WT3 (or DATS or whatever they call it now).
Will do. Thanks for the feedback.
This is great news. Please consider updating the website, I'd hate to see you lose sales over this. I know you have great support but some people simply won't bother to ask.
Yes, WT3 does charge for software updates, only one of the many reasons I'd like to avoid a WT3 (or DATS or whatever they call it now).
FWIW
I have both WT2 and WT3.
I would use the WT2 where more accurracy
is merited, but WT2 won't install on Wine ...
WT3 works like a charm.
There are customers running under Linux and Mac. Hit Keith up at tech@woofertester.com
We, Smith and Larson, are the inventors of The Woofer Tester (PX 390-800). The WT2 (390-802) is the second generation device that is USB connected.How accurate & reliable is Smith & Larson Audio's Woofer tester 2 in comparision to Dayton Audio's WT2 & WT3 woofer tester ?.
PX was our exclusive distributor. When they decided to make a copy of our WT2 and call it a WT3 they cancelled our place in their catalog and we launched our web site and began to sell to the public. We also sell the S&L WT2 through MCM/Newark/Farnell as the Speker Measurement Interface. It is a re-labeled S&L WT2. We re-sell through HarrisTech in BassBox bundles and we also sell the BassBox bundles.
The WT3 cannot match our accuracy and precision because they can copy our hardware (sort of) but our software is proprietary and it is copyrighted with the US Copyright Office. Keith Larson is our CTO, and he holds signal processing patents. The speed and precision with which the WT2 takes measurements is theoretically impossible. The fact that we do it is due to Keith's signal processing know-how.
To demonstrate how accurate the WT2 is, I wrote a white paper on WT2 accuracy which is on our web site and I posted earlier in this thread. If you measure the L and C with an LCR meter, the results of the RLC circuit are only so-so in the accuracy department say, 2 to 3 percent error. If you re-measure your L and C with a WT2 using it as an LCR meter, the results of the calculation of Fs and Qt compared to the measurement of the speaker emulator has less than 1% error. That is how good the WT2 is. It is a fantastic LCR meter as well as the most accurate Thiele/Small parameter measurement device you can buy at almost any price. I challenge anyone to create an LCR speaker emulator and get more accurate and precise results with any other T/S measurement system.
I performed the same test with a WT3 and the Fs and Qt were not consistent in 10 trials and the average of the trials results were 10X the error of a WT2. I chimed into this thread to give a push to DIY users to re-create my speaker emulator setup since the emulator is a very simple device that is perfect for a DIY user to replicate. The problem seems to be that nobody is going to have an LCR meter good enough to measure their L and C accurately enough to get within 1%. You need a WT2 to measure your L and C that accurately.
The "trick" is to measure the L and C at the calculated Fs from the spreadsheet. The WT2 is the only device I know of under $20,000 that can accurately measure L, C and R at any frequency between 1 HZ and 20kHz with frequency resolution 0.001 Hz.
Last edited:
As far as I can tell, the WT3 has an output impedance of 100 ohms, and uses that as the voltage divider.WT2 HW has a built in current amp, not so sure about WT3
We, Smith and Larson, are the inventors of The Woofer Tester (PX 390-800).
.
Hi Sir,
I was dead sure that (aka: woofer tester) was Mr. Brain Smith of Smith & Larson Audio. If you remember me I am Vivek Jaiswal (aka: Sidewinder18x ).
Just mailed you back last week. I was just finding out if somebody has any opinion or comments about your WT2. I will surely get back to you soon.
Vivek
If you look back through this thread from the beginning you will see some WT2 users give an opinion of the WT2 vs WT3.
Yes, I had been following all the previous post on this threads. I see positive vibes towards your WT2. Following the discussion from everyone I learnt about some added mass measurement. Is there any added mass procedure involved too ?. If yes, kindly explain in simplified words. That is where I am bit confused.If you look back through this thread from the beginning you will see some WT2 users give an opinion of the WT2 vs WT3.
The procedure is
1. Measure Fs/Qt of the speaker. This is just a mouse click on the WT2. The measurement requires 90 seconds to a couple of minutes.
2. Add some mass to the cone. Measure Vas. This is a mouse click for the WT2. The software prompts for the diameter of the cone from the middle of the surround to the middle of the surround on the other side. The software also prompts for the mass that is added.
Once the diameter and mass values are entered, the software measures the change in Fs due to the mass added and calculates the entire suite of T/S parameters.
If you want to find out the science behind all of the rigamarole, I recommend
1. Bob Bullock's Speaker Builder articles from the early 1980s. These articles became the book "Bullock on Boxes" which may be out of print.
2. Vance Dickason's Loudspeaker Cookbook
3. Joe D'appolito's book "Loudspeaker Measurement"
I have Vance Dickason's Loudspeaker Cookbook. I'll have a check on that.
Apart from your t/s parameter data measurement of WT2, are there any scope for additional data & measurements, like ....
(1) Freq Range measurement.
(2) imp vs freq resp & sensitivity graph, & any other related graphic representation in any form ..... like polar response & waterfall etc ????.
Last edited:
I have Vance Dickason's Loudspeaker Cookbook. I'll have a check on that.
Apart from your t/s parameter data measurement of WT2, are there any scope for additional data & measurements, like ....
(1) Freq Range measurement.
(2) imp vs freq resp & sensitivity graph, & any other related graphic representation in any form ..... like polar response & waterfall etc ????.
That would be a Speaker Tester. It is a WT2 plus microphone inputs and line outputs. Our web site has a comparison list of features of each product.
woofertester.com
Rub and buzz is a production test. As a DIY user, you can tell if a speaker is rubbing or buzzing by playing a low freq tone at high excursion. Audibly the rub/buzz is unmistakable. The WT2 lets you dial in any freq and play it through the line out jack. I use 15 Hz so that I can see the cone move. Shining a led/laser on the cone at 15 Hz lets you see a line segment representation of the excursion.
I regularly do both just to see the before and after. For design you use the after break-in parameters.When should a speaker be measured for t/s, before or after break in ?.
As a point of discussion, I have a 12 inch Tantric woofer that has an excursion in excess of 3 inches pk-pk. At rest the Fs is 32 Hz. At full excursion Fs is 17 Hz. It takes a couple of minutes for the surround to cool down but eventually the Fs returns to 32 Hz when using the WT2.
This is why we make the WTPro. Most people have no idea how different a speaker is at Xmax compared to at rest.
WT2 v.s WT3 tester
Hi everyone,
I’ve received my newly ordered WT2 tester (Smith & Larson Audio) a couple of days ago and have started to explore its features and capabilities. I’ve used the WT3 tester (Dayton Audio) for a long time and after all the discussion around the WT3 vs. WT2 capabilities I became interested in exploring and comparing the two.
The WT3 tester has never caused any real issues or problems for me. It has been reliable, fast and easy to use. Some people have raised doubts that the WT3 tester doesn’t produce correct Q values in T/S measurements. This is partly true, but based on the impedance plot produced by the WT3 tester the Q values are correctly calculated. The question is however, can the impedance plot be of higher resolution and detail in order to get a more accurate Q value calculation?
The answer is yes. The WT2 tester does seem to have a better algorithm and accuracy in measuring the resonance frequency at low frequencies. Besides that the WT2 tester has a lot more features than the WT3 tester (I haven’t tested all yet), but it also has a higher price tag. I think the higher price tag is fair given its more extensive features.
Partly due to its simpler functions the WT3 tester is easier and more intuitive to use and compared to the WT2 tester the user interface is more clean and robust to use. The WT2 user interface feels a bit outdated and is more cumbersome to use. The window handling doesn’t feel so consistent in its behavior. This shouldn’t be read as criticism on the WT2 capabilities, rather as suggestions of hints to improvements.
I haven’t yet tested and used all of the WT2 capabilities, but I have done some T/S parameter and impedance measurements to compare with similar tests on the WT3 tester.
Measurement setup:
WT2 tester (Smith & Larson Audio) v7.01
WT3 tester (Dayton Audio) v1.51b1
I’ve used a pair of high quality SB Accoustics Satori MW16P-4 mid-woofers and ScanSpeak Illuminator R3004/602010 tweeters with a high driver consistency for the measurement tests.
The “Delta mass” method is used for T/S parameters measurements and the Impedance plots are made with 344 measurement points for both the WT2 and WT3 tester. 344 measurement points is the setting the WT3 tester has and it cannot be changed. The frequency range is 1-20000Hz.
All drivers are measured “cold” without any e.g. suspension “massage” The WT2 and WT3 tester is calibrated with the same 10 Ohm precision (0.1%) calibration resistor.
The results are exported in the “zma” format and imported in to the WT3 tester for visual comparison.
Results:
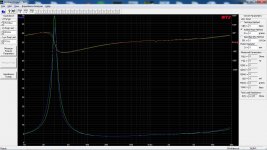
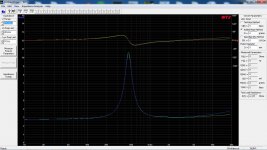
Green = WT2 tester
Blue = WT3 tester
Impedance sweep:
Picture1 shows the Satori MW16P-4 mid-woofer. We have some variation in the lower frequencies and above 10kHz, but between 100Hz and 10kHz the impedance plot is almost identical.
Picture2 shows the ScanSpeak R3004/602010 tweeter. The impedance around the resonance frequency is virtually identical. At higher frequencies starting at >5kHz we have some variation even though not a huge difference (about 0.18 Ohm @ 10kHz). Here the WT2 tester gives a result which appears to be closer to the manufacturer’s specification.
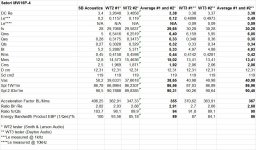
Picture3 shows the T/S parameters for the Satori mid-woofer. Not surprisingly, we have some variations here as well. The differences aren’t huge, but the WT3 tester seems to consequently give a bit higher Qts values. This is confirmed by test measurements I’ve done on other random drivers I have. Here I think the WT2 tester measurement method and its more detailed measurement resolution contributes to a more accurate result.
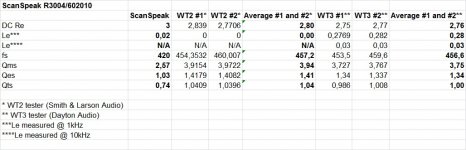
Picture4 shows the T/S parameters for the ScanSpeak. Here at higher resonance frequencies the variations are negligible. The resonance frequency is within 0,13% and the Re is within 1.5% between the WT2 and WT3 tester.
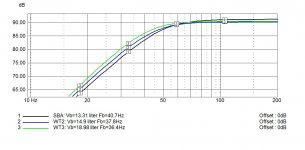
Picture5 shows the differences in a text book QB3 box alignment calculated from LspCad Pro based on T/S parameters from SB Acoustics specification, WT2 tester and the WT3 tester. Here we obviously can see some differences due to the different box volumes and port tunings.
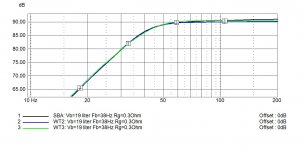
Picture6 shows the results using an enclosure with a volume of 19 liters, a port tuning of 38Hz and an added simulated filter coil resistance of 0.3 Ohm (Rg) based on T/S parameters from SB Acoustics specification, WT2 tester and the WT3 tester.
Ok, here we can see virtually the same response whether we used the manufacturer specification, the WT2 or the WT3 tester calculated T/S parameters.
Conclusion:
The WT2 tester does seem to be a bit more accurate in its T/S parameter and impedance measurements as well as featuring more functions than the WT3 tester. The WT3 tester however is simpler and faster to use and has a lower price tag than the WT2 tester.
As a comparison the WT3 tester does an impedance sweep in about 1.5 seconds. The WT2 tester takes about 8 minutes for the same impedance measurements setup (WT2 uses a Sine wave signal).
In real life, does it matter which one to choose for an accurate box design calculation or cross-over filter design?
In my opinion no, but if you want perfection for the T/S parameter calculation and the added features, go for the WT2 tester. If you don’t find the T/S parameter accuracy and the added features of the WT2 are the most important and prefers fast and simple measurements almost equally good for cross-over design, go for the WT3 tester.
I personally think both the WT2 and WT3 tester are nice tools and I will in the future use both where it’s applicable.
Regards
/Göran
Hi everyone,
I’ve received my newly ordered WT2 tester (Smith & Larson Audio) a couple of days ago and have started to explore its features and capabilities. I’ve used the WT3 tester (Dayton Audio) for a long time and after all the discussion around the WT3 vs. WT2 capabilities I became interested in exploring and comparing the two.
The WT3 tester has never caused any real issues or problems for me. It has been reliable, fast and easy to use. Some people have raised doubts that the WT3 tester doesn’t produce correct Q values in T/S measurements. This is partly true, but based on the impedance plot produced by the WT3 tester the Q values are correctly calculated. The question is however, can the impedance plot be of higher resolution and detail in order to get a more accurate Q value calculation?
The answer is yes. The WT2 tester does seem to have a better algorithm and accuracy in measuring the resonance frequency at low frequencies. Besides that the WT2 tester has a lot more features than the WT3 tester (I haven’t tested all yet), but it also has a higher price tag. I think the higher price tag is fair given its more extensive features.
Partly due to its simpler functions the WT3 tester is easier and more intuitive to use and compared to the WT2 tester the user interface is more clean and robust to use. The WT2 user interface feels a bit outdated and is more cumbersome to use. The window handling doesn’t feel so consistent in its behavior. This shouldn’t be read as criticism on the WT2 capabilities, rather as suggestions of hints to improvements.
I haven’t yet tested and used all of the WT2 capabilities, but I have done some T/S parameter and impedance measurements to compare with similar tests on the WT3 tester.
Measurement setup:
WT2 tester (Smith & Larson Audio) v7.01
WT3 tester (Dayton Audio) v1.51b1
I’ve used a pair of high quality SB Accoustics Satori MW16P-4 mid-woofers and ScanSpeak Illuminator R3004/602010 tweeters with a high driver consistency for the measurement tests.
The “Delta mass” method is used for T/S parameters measurements and the Impedance plots are made with 344 measurement points for both the WT2 and WT3 tester. 344 measurement points is the setting the WT3 tester has and it cannot be changed. The frequency range is 1-20000Hz.
All drivers are measured “cold” without any e.g. suspension “massage” The WT2 and WT3 tester is calibrated with the same 10 Ohm precision (0.1%) calibration resistor.
The results are exported in the “zma” format and imported in to the WT3 tester for visual comparison.
Results:
Green = WT2 tester
Blue = WT3 tester
Impedance sweep:
Picture1 shows the Satori MW16P-4 mid-woofer. We have some variation in the lower frequencies and above 10kHz, but between 100Hz and 10kHz the impedance plot is almost identical.
Picture2 shows the ScanSpeak R3004/602010 tweeter. The impedance around the resonance frequency is virtually identical. At higher frequencies starting at >5kHz we have some variation even though not a huge difference (about 0.18 Ohm @ 10kHz). Here the WT2 tester gives a result which appears to be closer to the manufacturer’s specification.
Picture3 shows the T/S parameters for the Satori mid-woofer. Not surprisingly, we have some variations here as well. The differences aren’t huge, but the WT3 tester seems to consequently give a bit higher Qts values. This is confirmed by test measurements I’ve done on other random drivers I have. Here I think the WT2 tester measurement method and its more detailed measurement resolution contributes to a more accurate result.
Picture4 shows the T/S parameters for the ScanSpeak. Here at higher resonance frequencies the variations are negligible. The resonance frequency is within 0,13% and the Re is within 1.5% between the WT2 and WT3 tester.
Picture5 shows the differences in a text book QB3 box alignment calculated from LspCad Pro based on T/S parameters from SB Acoustics specification, WT2 tester and the WT3 tester. Here we obviously can see some differences due to the different box volumes and port tunings.
Picture6 shows the results using an enclosure with a volume of 19 liters, a port tuning of 38Hz and an added simulated filter coil resistance of 0.3 Ohm (Rg) based on T/S parameters from SB Acoustics specification, WT2 tester and the WT3 tester.
Ok, here we can see virtually the same response whether we used the manufacturer specification, the WT2 or the WT3 tester calculated T/S parameters.
Conclusion:
The WT2 tester does seem to be a bit more accurate in its T/S parameter and impedance measurements as well as featuring more functions than the WT3 tester. The WT3 tester however is simpler and faster to use and has a lower price tag than the WT2 tester.
As a comparison the WT3 tester does an impedance sweep in about 1.5 seconds. The WT2 tester takes about 8 minutes for the same impedance measurements setup (WT2 uses a Sine wave signal).
In real life, does it matter which one to choose for an accurate box design calculation or cross-over filter design?
In my opinion no, but if you want perfection for the T/S parameter calculation and the added features, go for the WT2 tester. If you don’t find the T/S parameter accuracy and the added features of the WT2 are the most important and prefers fast and simple measurements almost equally good for cross-over design, go for the WT3 tester.
I personally think both the WT2 and WT3 tester are nice tools and I will in the future use both where it’s applicable.
Regards
/Göran
Attachments
-
 MW16P-4 #1 WT2 vs WT3.jpg308.8 KB · Views: 141
 -
 R3004-602010 #1 WT2 vs WT3.jpg310.4 KB · Views: 136
 -
 MW16P-4 T-S WT2 vs WT3.jpg241.6 KB · Views: 141
 -
 R3004-602010 T-S WT2 vs WT3.jpg112.7 KB · Views: 142
 -
 Box QB3 alignment WT2 vs WT3.jpg140.1 KB · Views: 132
 -
 Box 19liter WT2 vs WT3.jpg137 KB · Views: 60
- Status
- This old topic is closed. If you want to reopen this topic, contact a moderator using the "Report Post" button.
- Home
- Design & Build
- Equipment & Tools
- Faulty Dayton WT3...