I've spent quite a bit of time thinking about this today. Maybe the below is just poor thinking but it's what I have been wondering about.
There are two basic differences between my setup and what diyAudio member Preamp used for his LM317+TL431 tests. I am using an integrated Roland Quad Capture "sound card+pre-amp" while he used an ESI Juli@ sound card, and the Quad has both output gain and input sensitivity control whereas the Juli@ sound card just has volume control. Secondly, he was using a measurement pre-amplifier which could swing a far greater peak-to-peak voltage with its +-11V supplies than the one on my board which is supplied from +5V.
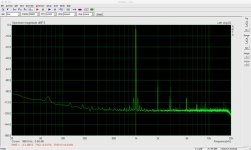
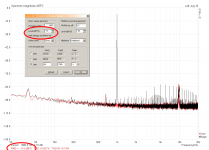
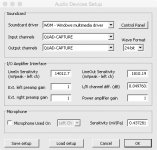
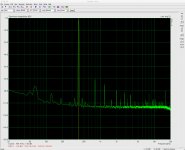
My Roland Quad Capture has reasonable specs. With ARTA I measured THD+N of about 0.018% when I used a quality RCA cable for the loopback (merely connecting output to input, asking it to play a 1kHz signal at about -3.5dB). See attached pic. This figure depends on how one optimises the Quad Capture's "input sensitivity" and "output gain". It's nice and flat with -3dB points are below 10Hz and about 18.5kHz. I think it compares ok with the specs on the Juli@ sound card used by Preamp but perhaps I am mistaken.
I measured the voltage at the output of the Quad Capture while it was delivering this -3.5dB 1kHz signal. Using 2V per division my scope read 3.4Vpp.
The measurement pre-amplifier on this board uses two LT1677 with a 5V supply and the op amps biased at mid supply. I measure the supply at 4.95V. The LT1677 data sheet has information on output voltage swing when supplied by +5V (and Vo=2.5V). I see that when the op amp is sinking or sourcing 2.5mA the output voltage can swing from GND+170mV (typical performance) to Vs-195mV. So I guess that the maximum sinusoidal waveform the amplifier can deliver without clipping is around 4.5V. (If Isource or Isink are higher the swing potential is lower. I'm not sure that there is way to refine what current is actually being sourced/sunk so let's stick with these figures for now.) If the gain truly is the modelled 48.9dB then the maximum amplitude that isn't clipped is therefore about 16mV.
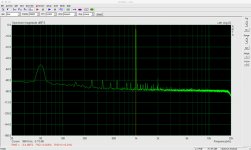
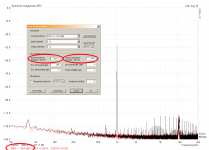
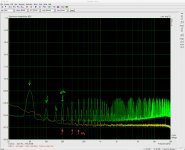
It's possible to do the same loopback test as above but incorporating this board's measurement pre-amp into the loop. Again, ask the sound card to play a 1kHz signal, adjust input sensitivity and output gain so the it's just below clipping and look at THD+N in ARTA. I got about 0.24% THD+N when I did this today. See second pic. Not great and considerably worse than the Quad Capture standalone. (Again the reading depends on optimising input sensitivity versus output gain on the Quad.)
I then used my scope to measure Vpp at the output of the measurement amplifier. Unfortunately I don't have a true RMS DMM. This Vpp scope measurement depends on the vertical resolution used. (Why?) ARTA mentions to use 2V per division for this measurement when calibrating devices so I used that. I got a number which bounced between 4.24V and 4.4V. Seems somewhat in the ball park for the LT1677 output voltage swing capability.
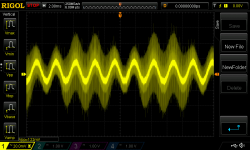
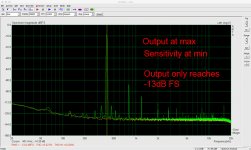
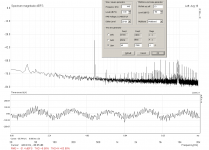
I can also use the scope to measure and examine the input waveform Vpp to the measurement pre-amplifier. And here in (at least) lies a problem. If I keep the vertical resolution at 2V per division I get a reading of 160mV. But as I lowered the resolution for a closer look I see the input wave to the measurement pre-amplifier is extremely noisy. See attached pic 3.
So the two amplifiers (Quad plus the measurement amplifier on this board) don't play well together. I'm wondering, could it be that the combination of high gain and relatively small output voltage swing of the measurement pre-amp conspire against the sound card because the maximum output voltage (to avoid system clipping) is very low (16mV)? If the input waveform was clean then it would point squarely at the measurement pre-amp. But the third image suggests to me that the Quad sound card can't produce a clean waveform at such low output levels (and I'm not convinced, yet, that an ESI Juli@ could as well).
Any of this make sense?
PS: I'm trying to remember if there was a reason why I didn't run the measurement amplifier from the 12V supply...
There are two basic differences between my setup and what diyAudio member Preamp used for his LM317+TL431 tests. I am using an integrated Roland Quad Capture "sound card+pre-amp" while he used an ESI Juli@ sound card, and the Quad has both output gain and input sensitivity control whereas the Juli@ sound card just has volume control. Secondly, he was using a measurement pre-amplifier which could swing a far greater peak-to-peak voltage with its +-11V supplies than the one on my board which is supplied from +5V.
My Roland Quad Capture has reasonable specs. With ARTA I measured THD+N of about 0.018% when I used a quality RCA cable for the loopback (merely connecting output to input, asking it to play a 1kHz signal at about -3.5dB). See attached pic. This figure depends on how one optimises the Quad Capture's "input sensitivity" and "output gain". It's nice and flat with -3dB points are below 10Hz and about 18.5kHz. I think it compares ok with the specs on the Juli@ sound card used by Preamp but perhaps I am mistaken.
I measured the voltage at the output of the Quad Capture while it was delivering this -3.5dB 1kHz signal. Using 2V per division my scope read 3.4Vpp.
The measurement pre-amplifier on this board uses two LT1677 with a 5V supply and the op amps biased at mid supply. I measure the supply at 4.95V. The LT1677 data sheet has information on output voltage swing when supplied by +5V (and Vo=2.5V). I see that when the op amp is sinking or sourcing 2.5mA the output voltage can swing from GND+170mV (typical performance) to Vs-195mV. So I guess that the maximum sinusoidal waveform the amplifier can deliver without clipping is around 4.5V. (If Isource or Isink are higher the swing potential is lower. I'm not sure that there is way to refine what current is actually being sourced/sunk so let's stick with these figures for now.) If the gain truly is the modelled 48.9dB then the maximum amplitude that isn't clipped is therefore about 16mV.
It's possible to do the same loopback test as above but incorporating this board's measurement pre-amp into the loop. Again, ask the sound card to play a 1kHz signal, adjust input sensitivity and output gain so the it's just below clipping and look at THD+N in ARTA. I got about 0.24% THD+N when I did this today. See second pic. Not great and considerably worse than the Quad Capture standalone. (Again the reading depends on optimising input sensitivity versus output gain on the Quad.)
I then used my scope to measure Vpp at the output of the measurement amplifier. Unfortunately I don't have a true RMS DMM. This Vpp scope measurement depends on the vertical resolution used. (Why?) ARTA mentions to use 2V per division for this measurement when calibrating devices so I used that. I got a number which bounced between 4.24V and 4.4V. Seems somewhat in the ball park for the LT1677 output voltage swing capability.
I can also use the scope to measure and examine the input waveform Vpp to the measurement pre-amplifier. And here in (at least) lies a problem. If I keep the vertical resolution at 2V per division I get a reading of 160mV. But as I lowered the resolution for a closer look I see the input wave to the measurement pre-amplifier is extremely noisy. See attached pic 3.
So the two amplifiers (Quad plus the measurement amplifier on this board) don't play well together. I'm wondering, could it be that the combination of high gain and relatively small output voltage swing of the measurement pre-amp conspire against the sound card because the maximum output voltage (to avoid system clipping) is very low (16mV)? If the input waveform was clean then it would point squarely at the measurement pre-amp. But the third image suggests to me that the Quad sound card can't produce a clean waveform at such low output levels (and I'm not convinced, yet, that an ESI Juli@ could as well).
Any of this make sense?
PS: I'm trying to remember if there was a reason why I didn't run the measurement amplifier from the 12V supply...
Attachments
Last edited:
Look at your first arta plot: k1 80dB, k2 90dB, that looks like either input or output are clipped already. Try some dB less for the signal generator.
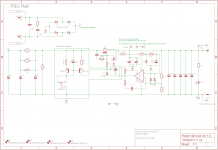
And where's the schematic for your preamp (didn't look for it yet)? How did you build your v/2 ref?
Edit: found it... Does that really work outside the simulator? What do you measure at the non-inverting inputs when no signal is supplied at the input?
Edit2: what settings does your roland have for gain and sensitivity? I'd start out with a gain of 1 (0dB) and minimum input sensitivity, since it probably has an additional preamp rather than a selectable attenuator.
Last edited:
Hi Lasse
Thanks for posting and thanks for the PM. First your points above:
1. not sure I follow this first one. k1? k2? In doing the loopback test, the signal generator is asking the sound card to play a 1kHz signal at -3dB FS. Hence I was targeting volume settings to deliver approximately that in Spectrum Analyser. The Quad Capture has a clipping indicator and it wasn't lit. Of course, if I pushed the volume higher it did clip.
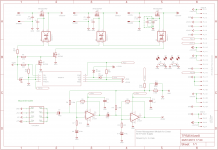
2. Circuit attached here again. The op amps are biased by the 5V supply. The supply circuits are discussed in this thread. I have attached the circuit below. (Note the simplifications annotated for the 5V and 3V3 circuits as the 12V supply powers their op amps and Vref.)
I think you hit the nail on the head when you said in your PM just now:
That was thinking I was coming to in post 282.
Regarding your edits:
1. I will revert
2. The Roland Quad Capture has a dial for SENS (each channel) and one for OUTPUT. When I did the THD+N tests I optimised these for best THD+N.
If I am going to use something like ARTA to test these PSU rails - and it does at the moment seem better than relying on the FFT of my scope for which I'd still have to find a calibration method - I'd need some confidence that the sound card and the on-board measurement amplifier can work together.
You got amazing THD+N numbers for your Juli@ and pre-amp combined (0.00028%). I don't think you needed to use an attenuator. My key question is whether the circa 4.5V swing on this on-board/measurement pre-amp would be fine if I dropped a Juli@ into my computer. (I actually have one in my audio server but it has been bastardised somewhat so dropping it into my Mac is not so easy.) If it helps a lot I think I could jimmy the board to power and bias the measurement amplifier's op amps with the +12V supply.
Thanks for posting and thanks for the PM. First your points above:
1. not sure I follow this first one. k1? k2? In doing the loopback test, the signal generator is asking the sound card to play a 1kHz signal at -3dB FS. Hence I was targeting volume settings to deliver approximately that in Spectrum Analyser. The Quad Capture has a clipping indicator and it wasn't lit. Of course, if I pushed the volume higher it did clip.
2. Circuit attached here again. The op amps are biased by the 5V supply. The supply circuits are discussed in this thread. I have attached the circuit below. (Note the simplifications annotated for the 5V and 3V3 circuits as the 12V supply powers their op amps and Vref.)
I think you hit the nail on the head when you said in your PM just now:
Generating such a low output directly with the soundcard will be very noisy and pretty messy, so don't try that. Using an attenuator is the better way to do this.
That was thinking I was coming to in post 282.
Regarding your edits:
1. I will revert
2. The Roland Quad Capture has a dial for SENS (each channel) and one for OUTPUT. When I did the THD+N tests I optimised these for best THD+N.
If I am going to use something like ARTA to test these PSU rails - and it does at the moment seem better than relying on the FFT of my scope for which I'd still have to find a calibration method - I'd need some confidence that the sound card and the on-board measurement amplifier can work together.
You got amazing THD+N numbers for your Juli@ and pre-amp combined (0.00028%). I don't think you needed to use an attenuator. My key question is whether the circa 4.5V swing on this on-board/measurement pre-amp would be fine if I dropped a Juli@ into my computer. (I actually have one in my audio server but it has been bastardised somewhat so dropping it into my Mac is not so easy.) If it helps a lot I think I could jimmy the board to power and bias the measurement amplifier's op amps with the +12V supply.
Attachments
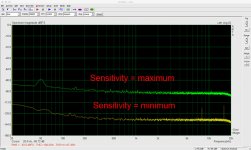
2. The Roland Quad Capture has a dial for SENS (each channel) and one for OUTPUT. When I did the THD+N tests I optimised these for best THD+N.
The attached pics are probably the best way of showing the impact of sensitivity and output.
With output at its minimum there's just the noise floor (as determined by sensitivity). Because I was targeting a db FS figure for 1kHz of close to -3dB FS (as per the Generator in ARTA) I couldn't get there by just turning the output up. Also note the THD+N in the second pic. A little less than full output and a bit more sensitivity got to a lower THD+N of 0.018%.
Attachments
What do you measure at the non-inverting inputs when no signal is supplied at the input?
If the input is grounded? With scope set at 10mV per vertical division and 10uS per horizontal I get a Vpp reading of 13.2mV at the + input.
EDIT: 2.3V RMS w/ DC coupling is, I think, the answer you were really after
Last edited:
Okay, some answers on the quick. Hope to find some more time later.
Should have been k2 and k3, meaning the second and third harmonic, 800Hz and 1200Hz in this case.
Remember that FS means full scale, so -3dBFS from the generator means close to the maximum the soundcard can put out. Try some lower level (-6, -9) and see if the THD gets better. DON'T fiddle with the knobs to read -3dBFS in the spectrum! The 0dBFS points for input and output do not have to be the same level, and in your case they certainly are not!
So: First find a OUTPUT dBFS setting that gives a clean sine with as little THD as possible. Then measure the real output voltage at the OUTPUT and enter that into arta. That will correlate (or calibrate) your OUTPUT dBFS to the dBV scale.
Then you can do the same with the INPUT.
And for the clipping indicator: forget about it! It will only show rather severe clipping, a couple % probably, but for a clean measurement you will want totally no clipping.
That was just for the soundcard itself, without the preamp. I didn't measure the preamp's THD, since it was built and used for a different purpose than amplifying audio.
I was actually expecting something along the line of 2.5VDC. If it's 13.2mV only, your amp can basically only swing more positive than that...
1. not sure I follow this first one. k1? k2? In doing the loopback test, the signal generator is asking the sound card to play a 1kHz signal at -3dB FS. Hence I was targeting volume settings to deliver approximately that in Spectrum Analyser. The Quad Capture has a clipping indicator and it wasn't lit. Of course, if I pushed the volume higher it did clip.
Should have been k2 and k3, meaning the second and third harmonic, 800Hz and 1200Hz in this case.
Remember that FS means full scale, so -3dBFS from the generator means close to the maximum the soundcard can put out. Try some lower level (-6, -9) and see if the THD gets better. DON'T fiddle with the knobs to read -3dBFS in the spectrum! The 0dBFS points for input and output do not have to be the same level, and in your case they certainly are not!
So: First find a OUTPUT dBFS setting that gives a clean sine with as little THD as possible. Then measure the real output voltage at the OUTPUT and enter that into arta. That will correlate (or calibrate) your OUTPUT dBFS to the dBV scale.
Then you can do the same with the INPUT.
And for the clipping indicator: forget about it! It will only show rather severe clipping, a couple % probably, but for a clean measurement you will want totally no clipping.
You got amazing THD+N numbers for your Juli@ and pre-amp combined (0.00028%).
That was just for the soundcard itself, without the preamp. I didn't measure the preamp's THD, since it was built and used for a different purpose than amplifying audio.
If the input is grounded? With scope set at 10mV per vertical division and 10uS per horizontal I get a Vpp reading of 13.2mV at the + input.
EDIT: 2.3V RMS w/ DC coupling is, I think, the answer you were really after
I was actually expecting something along the line of 2.5VDC. If it's 13.2mV only, your amp can basically only swing more positive than that...
With this sound card harmonic distortion appears at a relatively early stage and the bulk of the THD+N figure is THD. Even -20db FS THD approaches 0.01%. That's ok. I know that for this to be any good I will need a sound card that doesn't have THD as high as this. But in your LM317+TL431 tests your noise floor was below -170dB above 100Hz. I'm nowhere near that at the moment. Those charts are for your sound card and pre-amp combined, correct (with DUT off)? *** What I am trying to get my head around at the moment is what the combination of the sound card and pre-amp does versus just the sound card. Is it the combination that pushes the noise floor lower or is it that the noise floor for the Juli@ was already down there and the pre-amp didn't make it worse?
Regarding output db FS levels... I'm struggling with this a bit. The ultimate purpose of this is to calibrate ARTA's vertical scale. Without a well-calibrated voltage scale relative tests are fine, but one can have little to no confidence in absolute numbers. The default setting for ATRA's spectrum analyser generator and that used to Calibrate Devices is -3dB. The output voltage of the sound card varies with the volume setting. Surely to get a proper calibration of scale the volume needs to be set such that the output produces the same level in Spectrum Analyser as is being asked of it by Generator. If you measure the output voltage when it is generating -10db FS versus -3dB then your vertical scale will be wrong, no? Sure lower levels may improve THD+N but the result is misleading - if THD is a big component, dropping the output volume to zero will improve things greatly but you've not calibrated the vertical scale. Perhaps I am being stupid here.
*** I'd be interested in what your combined sound card + pre-amp figures were.
I measured 2.3V DC so not so far off. So, unless I'm mistaken the output can swing 2x this i.e. very close to my previous analysis. I'll look into running the pre-amp of the 12V supply, thereby more than doubling the potential swing.
BTW I realize now that I have been using similar software for some time now. I use Room Equalisation Wizard for room acoustics analysis. The same need for scale calibration is needed there. Because it is only concerned with response measured via microphone the calibration is done with an SPL meter. It is a bit easier because, with white noise playing, the SPL measure/input being received by the software can be compared directly and continuously with an SPL meter. The volume doesn't need to be at a specific level because both input and reference move together. Here, the input to the software needs to be disconnected to measure voltage. Hence why I think the output needs to be set at a specific expected level prior to measuring the voltage. Only then can the software equate that output voltage measurement to a db FS or dbV level. Am I wrong?
The dBFS scale is only relevant for your soundcard and has no merits for any measurements. You simply have to make sure that you never exceed 0dBFS in any case, neither with the signal generator (which should be no problem) nor with your input (feed it 20Vpp and it will surely clip).
A relevant scale is dBV, where 0dBV equals 1Vrms or 1.41Vp or 2.82Vpp. The whole reason for calibration is to correlate 0dBV with the capabilities of your soundcard. To do this, you generate a signal with your soundcard, like -3dBFS, and then make a physical measurement of the actual level. This will be entered into arta and thus the software knows how to calculate the dBV scale. You have to set the scale to dBV, or else arta will still display dBFS and the whole calibration seems to have had no effect at all.
Same thing with the input. Let's say you feed it with 1Vrms, so 0dBV, and the spectrum shows -10dBFS. This tells you that the input is not clipped yet and still has some headroom. Now you tell arta that -10dBFS at the input correlate with 0dBV (via calibration) and voila, the dBV scale for the input is accurate. Again you have to set the display to dBV instead of dBFS.
The noise floor will rise if you connect a preamp to the input. With the scale set to dBFS you can clearly see that. The noisefloor in dBV will be lower though, if you enter the external preamp gain in the setup. This seems counter-intuitive at first, but you have to bear in mind that your soundcard will start to clip long before it can display 0dBV, because you shifted the correlation between dBV and dBFS by as much as your preamps gain.
If you have additional controls like volume or input sensitivity, they must stay the same as when you did the calibration, or else the calibration will be off.
One more time: If you generate -3dB(FS), you don't have to fiddle with anything to read -3dB in the spectrum! If, and only if, both FS-scales of output and input match the same voltage level, will you read -3dBFS in the spectrum! And only if the aforementioned is true AND -3dBFS perfectly matches -3dBV, then you will read -3dBV in the spectrum. This is highly unrealistic though with "normal" soundcards though, I'd say.
I will post the values of my soundcard and calibration once I'm back at my computer, which will be later or tomorrow...
Okay. I think I am slowly getting this. Is the following summary of the calibration process correct:
1. Without the measurement amplifier in the loop, set a volume level for the sound card that minimises THD+N using Spectrum Analyser. It will likely be well below -3dB FS and that's fine. Leave this volume level constant from there on. Leave the Input Sensitivity set at a minimum (I assume this is just zero gain at input) while doing this.
2. Go to Set Up -> Calibrate Devices.
3. Sound Card Full Scale Output (mV). We now measure what voltage is produced by the sound card (with the volume set as per 1) when asked to play a signal at an output level of -3dB. Once entered the output volume setting is calibrated to a voltage (Vpp read with a scope set at 2V per division).
3. Sound Card Full Scale Input (mV). For each channel, using the previously measured output voltage which is automatically populated, we use a loopback to estimate the Peak Input (mV) which the sound card can handle. The ARTA guide says (my emphasis):
I presume 1. means I dial the Sensitivity to maximum.
(We can skip the mic calibration for these purposes.)
4. Go to Set Up -> Audio Devices I/O Amplifier Interface. Line-In/Out sensitivity will already be populated by the foregoing. Enter the measurement pre-amplifier gain into both channels. Leave the Power Amplifier Gain at 1.
I haven't yet measured the actual pre-amplifier gain. To do this I would need to feed a clean, known amplitude signal in and measure the output. In the current case, the input amplitude can't exceed about 16mV else the pre-amp will clip. So I still need a good signal generator for this as trying to use the sound card at such low levels invites noise etc (although I could use the sound card if I were to place an attenuator between it and the pre-amp so that I can drive the sound card at higher levels).
5. When doing measurements, ensure the Spectrum Analyser scale is always dBV.
Finally, the potential shortcomings in my current setup are:
1. Limited output voltage swing in the measurement amplifier op amps. Can be improved if I run the measurement amplifier off 12V rather than 5V.
2. The sound card I have immediately to hand to familiarise myself with all this does seem to suffer from poor THD (circa 0.012% when the volume is set as per 1 above) and so I would benefit from acquiring a better sound card (e.g. the ESI Juli@ xTE - I think the price of the Lynx E22 is a bit excessive for this)
1. Without the measurement amplifier in the loop, set a volume level for the sound card that minimises THD+N using Spectrum Analyser. It will likely be well below -3dB FS and that's fine. Leave this volume level constant from there on. Leave the Input Sensitivity set at a minimum (I assume this is just zero gain at input) while doing this.
2. Go to Set Up -> Calibrate Devices.
3. Sound Card Full Scale Output (mV). We now measure what voltage is produced by the sound card (with the volume set as per 1) when asked to play a signal at an output level of -3dB. Once entered the output volume setting is calibrated to a voltage (Vpp read with a scope set at 2V per division).
3. Sound Card Full Scale Input (mV). For each channel, using the previously measured output voltage which is automatically populated, we use a loopback to estimate the Peak Input (mV) which the sound card can handle. The ARTA guide says (my emphasis):
You can use an external generator or the output channel of the soundcard to calibrate the input channels. If using the output channel of the soundcard as a calibrated generator:
1. Set the left and the right line input volume to maximum.
2. Connect the left output to the left line input.
3. Press the button 'Estimate Max Input mV', and monitor the input level at bottom peak-meters. If the soundcard input is clipping, lower the level of input volume.
4. Enter the value of signal generator voltage in the edit box, but only if it differs from value used during output channel calibration.
I presume 1. means I dial the Sensitivity to maximum.
(We can skip the mic calibration for these purposes.)
4. Go to Set Up -> Audio Devices I/O Amplifier Interface. Line-In/Out sensitivity will already be populated by the foregoing. Enter the measurement pre-amplifier gain into both channels. Leave the Power Amplifier Gain at 1.
I haven't yet measured the actual pre-amplifier gain. To do this I would need to feed a clean, known amplitude signal in and measure the output. In the current case, the input amplitude can't exceed about 16mV else the pre-amp will clip. So I still need a good signal generator for this as trying to use the sound card at such low levels invites noise etc (although I could use the sound card if I were to place an attenuator between it and the pre-amp so that I can drive the sound card at higher levels).
5. When doing measurements, ensure the Spectrum Analyser scale is always dBV.
Finally, the potential shortcomings in my current setup are:
1. Limited output voltage swing in the measurement amplifier op amps. Can be improved if I run the measurement amplifier off 12V rather than 5V.
2. The sound card I have immediately to hand to familiarise myself with all this does seem to suffer from poor THD (circa 0.012% when the volume is set as per 1 above) and so I would benefit from acquiring a better sound card (e.g. the ESI Juli@ xTE - I think the price of the Lynx E22 is a bit excessive for this)
Ok great. Thanks. I am using a Mac (running ARTA on Crossover) and so this don't have any volume control except the dials on the box (albeit thy can be managed via software).
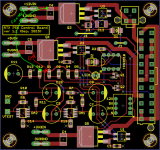
I am going to modify the board by cutting a trace as marked in the attached and connecting R12 to the 12V supply.
I am going to modify the board by cutting a trace as marked in the attached and connecting R12 to the 12V supply.
Attachments
So here're my ARTA calibration values:
LineIn: 3161.3 mVp
LineOut: 2972 mVp
Those were automatically calculated by ARTA, because I've entered the measured values for -3dBFS in the calibration form. Note that the Generator Setup form automatically translates your dBFS into Vrms (see screenshot). This is a value that you can easily measure to verify your calibration.
Since I happen to have my preamp at home at the moment, I just measured the loop with the preamp set to 40dB and the generator set to ~10mVrms, which is -46dBFS in my case. The resulting -6.5dBFS tells us that the input can handle 1VRMS with some 6dB headroom, while the -39.5dBV resembles our 10mVrms generator signal with ext. preamp gain already corrected for.
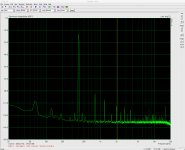
As you can see from the screenshots, THD is now 0.05%, so the preamp definitely makes matters worse than a simple loopback. The red trace shows the noise floor of the preamp with everything set up as before, but simply with the generator in ARTA turned off. Notice the bump around 10kHz which is already present in the noise floor measurement. This must be some noise coming out of my computer, which is additionally amplified by the preamp and makes the THD reading somewhat worse than it actually is. The even harmonics (3k, 4k, ... 9k) are present in the noise floor measurement, too. Setting the generator to 440Hz yields a better THD of 0.027%, for instance.
Now 10mV is a rather low value, but as you can see, the Juli@ manages it pretty well actually. Since I don't have a decent signal generator in the workshop (and no decent soundcard either), I happen to use a netbook or MP3 player as siggen when in a pinch. As long as the volume is turned up this is fine, but very low levels like 10mV are absolutely rubbish with cheap MP3 players or Realtek 5.1 chipsets. AFAIC low levels are thus better avoided, as long as you don't know how well your hardware performs.
LineIn: 3161.3 mVp
LineOut: 2972 mVp
Those were automatically calculated by ARTA, because I've entered the measured values for -3dBFS in the calibration form. Note that the Generator Setup form automatically translates your dBFS into Vrms (see screenshot). This is a value that you can easily measure to verify your calibration.
Since I happen to have my preamp at home at the moment, I just measured the loop with the preamp set to 40dB and the generator set to ~10mVrms, which is -46dBFS in my case. The resulting -6.5dBFS tells us that the input can handle 1VRMS with some 6dB headroom, while the -39.5dBV resembles our 10mVrms generator signal with ext. preamp gain already corrected for.
As you can see from the screenshots, THD is now 0.05%, so the preamp definitely makes matters worse than a simple loopback. The red trace shows the noise floor of the preamp with everything set up as before, but simply with the generator in ARTA turned off. Notice the bump around 10kHz which is already present in the noise floor measurement. This must be some noise coming out of my computer, which is additionally amplified by the preamp and makes the THD reading somewhat worse than it actually is. The even harmonics (3k, 4k, ... 9k) are present in the noise floor measurement, too. Setting the generator to 440Hz yields a better THD of 0.027%, for instance.
Now 10mV is a rather low value, but as you can see, the Juli@ manages it pretty well actually. Since I don't have a decent signal generator in the workshop (and no decent soundcard either), I happen to use a netbook or MP3 player as siggen when in a pinch. As long as the volume is turned up this is fine, but very low levels like 10mV are absolutely rubbish with cheap MP3 players or Realtek 5.1 chipsets. AFAIC low levels are thus better avoided, as long as you don't know how well your hardware performs.
Attachments
Thanks Lasse.
I did the following:
1. Decided upon an output level for the Quad Capture sound card (with input sensitivity set to minimum) as per 1 in post 293. I used a 400Hz -3dB FS stimulus via Generator. Pic 1 shows that I settled on an output level which was -20dBFS and obtained THD+N of 0.016%.
2. I detached the loop, measured 1.28Vp (it helped a lot when I finally realised it was meant to Vp and not Vpp) with my scope at the output of the sound card while playing the Calibrate Devices Generate Sinus (400Hz) -3dB and entered this number into the Calibrate Devices 'Soundcard Full Scale Output' tab to estimate peak output. I then reconnected the loopback to go through the procedure to calibrate sound card full scale input. See pic of Audio Devices pane.
3. I then ran the loopback again from Spectrum Analyser (same 400Hz -3dB FS stimulus; the generator indicated an RMS voltage of 0.907589V which equates to 1.28Vp) but this time with the graphic scale set to dBV. See pic 3.
4. While I haven't yet measured the actual gain of the measurement amplifier I entered the modelled gain (278.8x) in Setup Audio Devices->Ext. Preamp Gain. So my scale in the following may not be accurate but I couldn't resist taking a look. Relative comparisons should remain valid.
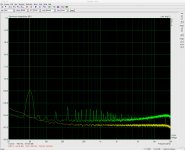
5. I coupled the output of the board's measurement amplifier to the input of the sound card and had a look via Spectrum Analyser. Pic 4. The mustard coloured spectrum is with the pre-amp input grounded. The chartreuse spectrum is the 5V supply.
Can you guys help me interpret this last pic? There are peaks in the noise floor every 100Hz out to about 1kHz. The 5V supply has peaks every 50Hz. I presume some of these are generated by the harmonic distortion of the sound card but the pattern in the 5V supply is particularly puzzling.
(BTW if I touch the top of C7 which is the coupling capacitor at the input of the measurement pre-amp it greatly affects the results...)
I did the following:
1. Decided upon an output level for the Quad Capture sound card (with input sensitivity set to minimum) as per 1 in post 293. I used a 400Hz -3dB FS stimulus via Generator. Pic 1 shows that I settled on an output level which was -20dBFS and obtained THD+N of 0.016%.
2. I detached the loop, measured 1.28Vp (it helped a lot when I finally realised it was meant to Vp and not Vpp) with my scope at the output of the sound card while playing the Calibrate Devices Generate Sinus (400Hz) -3dB and entered this number into the Calibrate Devices 'Soundcard Full Scale Output' tab to estimate peak output. I then reconnected the loopback to go through the procedure to calibrate sound card full scale input. See pic of Audio Devices pane.
3. I then ran the loopback again from Spectrum Analyser (same 400Hz -3dB FS stimulus; the generator indicated an RMS voltage of 0.907589V which equates to 1.28Vp) but this time with the graphic scale set to dBV. See pic 3.
4. While I haven't yet measured the actual gain of the measurement amplifier I entered the modelled gain (278.8x) in Setup Audio Devices->Ext. Preamp Gain. So my scale in the following may not be accurate but I couldn't resist taking a look. Relative comparisons should remain valid.
5. I coupled the output of the board's measurement amplifier to the input of the sound card and had a look via Spectrum Analyser. Pic 4. The mustard coloured spectrum is with the pre-amp input grounded. The chartreuse spectrum is the 5V supply.
Can you guys help me interpret this last pic? There are peaks in the noise floor every 100Hz out to about 1kHz. The 5V supply has peaks every 50Hz. I presume some of these are generated by the harmonic distortion of the sound card but the pattern in the 5V supply is particularly puzzling.
(BTW if I touch the top of C7 which is the coupling capacitor at the input of the measurement pre-amp it greatly affects the results...)
Attachments
Hmm.. I went for a jog, came home, switched on the power supply and did the test again - with a much better result for both. Go figure. I will have to investigate.
This time, though, a much cleaner ground floor. What it did highlight was that I was getting crosstalk (?) from the output as I had the generator on when doing the spectrum analysis. Turning it off removed a little 400Hz signal and its harmonics.
Attached is the revised output. (Mustard is with measurement pre-amp input grounded and chartreuse is the 5V.)
PS: can I glean from the max dBV (again assuming I have the correct pre-amp gain) that the LT1677 aren't clipping with a 5V supply?
Attachments
PS: can I glean from the max dBV (again assuming I have the correct pre-amp gain) that the LT1677 aren't clipping with a 5V supply?
Yes, pretty sure. If the scale is somewhere near accurate, that'd be something like 10uV @ 50Hz, times 300 = 3mV output swing of the preamp.
If that's all you want to measure with it - ripple on the psu - you'll be fine. Try to reduce the feedback resistors of the first amp for lowest possible noise. I went with 1k and 10R, which should be easy to drive by any opamp at such low signal levels.
Crosstalk from output to input is nasty. Try if it does that with no cables connected, too (which would be really bad); else try other cables.
Touching a coupling capacitor makes you the antenna for every kind of EMI and ugly stuff. Put the whole amp into a properly shielded case for best results.
Check out this video (thanks to Salas for posting this in another thread; very educative): https://www.youtube.com/watch?v=BFLZm4LbzQU
Hook up your preamp, fire up ARTA (without averaging and a smaller FFT value for a higher refresh rate), and then watch the spectrum as you move a plugged in mains cord along your preamp. Then try to arrange and route all your cables and stuff on the bench for the lowest possible noise...
Edit: Does your input really handle 14Vp (almost 10Vrms) with sensitivity set to minimum? This looks more like an attenuator than a preamp. You set the input sensitivity via software?
Last edited:
- Status
- This old topic is closed. If you want to reopen this topic, contact a moderator using the "Report Post" button.
- Home
- Amplifiers
- Power Supplies
- Enough current to turn on 3 mosfets?