Correction
What is the best idle current trough the endstage for safe drive and low distortion? 10mA, 20 or 30?
Panson should answer this as well, but, I seem to remember that Mark (Audioman54) who specificed the chip said that they found a lower idle current to give the best performance - I recall him mentioning 22mA.
Ken
Hi Panson,
Very nice! Are you using pre-drivers? And what drivers are you using?
Ken
Hi Ken,
No pre-driver is needed in this design. I mainly use MJE15030/15031 as driver. Electrically identical pair MJF15030/15031 are employed in the test unit shown in the above picture.
Panson
Correction
What is the best idle current trough the endstage for safe drive and low distortion? 10mA, 20 or 30?
Yes, it was about 22 mA for the test.
Hi panson
Great work and in progress of more goodies? Easy balanced unbalanced approach?
I have a question regarding adjustment of the bias current trough the Thermal Trak diodes. How much is the best for using the LME49811?
Hi Radioman62,
I would use an op-amp to do balanced input. This is in my plan. A power supply + inrush limiter board and VI protection board are in my plan as well.
Panson
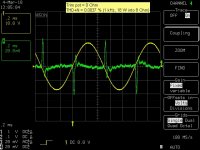
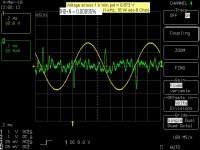
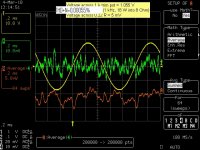
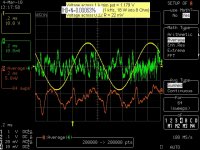
Bias tuning
Here are results for bias adjustment of the Compact LME49811 TT amp.
Bias circuit is the simplest one: multi-turn 1 k pot and two TT diodes in series. Supply rails is +/- 78V unload.
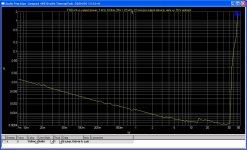
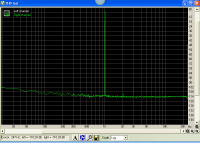
Set the pot to zero Ohm for min. bias setting. The output waveform (1 kHz 18 W into 8 Ohm) and distortion residual are shown in the first (left most) picture. Crossover spikes is clearly seen. At this bias level, THD+N is 0.0037 %. This is not bad at all.
The bias level is increased to which the voltage across the pot is 0.873 V. At this level, voltage drop across 0.22R emitter resistor is still too low to measure for a Fluke 179. THD+N is 0.00095 %.
When the bias is increased to which the pot voltage drop is 1.055 V. The bias current per output TT is about 23 mA. THD+N is now 0.00055 %. This agrees with Mark's advice.
Increasing the bias to 100 mA per output TT. THD+N slightly increases to 0.00063 %. The so-called gm-doubling causes the rise?
The right most curve show the THD+N vs power. The amp aproaches the limit of my AP System One.
Here are results for bias adjustment of the Compact LME49811 TT amp.
Bias circuit is the simplest one: multi-turn 1 k pot and two TT diodes in series. Supply rails is +/- 78V unload.
Set the pot to zero Ohm for min. bias setting. The output waveform (1 kHz 18 W into 8 Ohm) and distortion residual are shown in the first (left most) picture. Crossover spikes is clearly seen. At this bias level, THD+N is 0.0037 %. This is not bad at all.
The bias level is increased to which the voltage across the pot is 0.873 V. At this level, voltage drop across 0.22R emitter resistor is still too low to measure for a Fluke 179. THD+N is 0.00095 %.
When the bias is increased to which the pot voltage drop is 1.055 V. The bias current per output TT is about 23 mA. THD+N is now 0.00055 %. This agrees with Mark's advice.
Increasing the bias to 100 mA per output TT. THD+N slightly increases to 0.00063 %. The so-called gm-doubling causes the rise?
The right most curve show the THD+N vs power. The amp aproaches the limit of my AP System One.
Attachments
Last edited:
0.00055%distortion and little of crossover. great.
0.00095%distortion including some crossover due to under-biasing. The numerical figure looks great, we know from experience it sounds terrible.
Yet the crossover has apparently added just 0.0004% to the distortion.
Your excellent plots explain all for us. Thanks.
0.00095%distortion including some crossover due to under-biasing. The numerical figure looks great, we know from experience it sounds terrible.
Yet the crossover has apparently added just 0.0004% to the distortion.
Your excellent plots explain all for us. Thanks.
Hi Andrew0.00055%distortion and little of crossover. great.
0.00095%distortion including some crossover due to under-biasing. The numerical figure looks great, we know from experience it sounds terrible.
Yet the crossover has apparently added just 0.0004% to the distortion.
"We know from experience" ??...
What do you or anyone else know about differences in the 0.000* distortion areas?
How can 0,00055 and 0.00095 % distortion be heard that different, to the extent that you can say "we know from experience" ?
This one you have to elaborate Andrew. I'm sorry I don't read all posts at this forum, and also I have not all that skill, but I'm not a totally numb noob.
")
How can 0,00055 and 0.00095 % distortion be heard that different, to the extent that you can say "we know from experience" ?
It can't be. I'm with you on this Ove. "Terrible" is an extremely descriptive word and may not be correctly used here.
Bias tuning
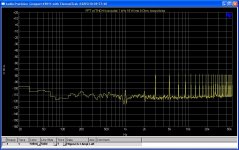
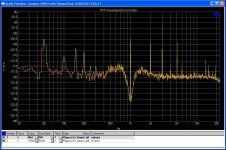
The harmonic structure should reveal more information related to sonic performance. FFT of distortion residual for the above four bias conditions are shown here. The rich high order harmonics are evident of crossover distortion.
For the optimum bias (22 mA), the remaining 2nd and 5th harmonics are at very low level (<100 dBV).
Attachments
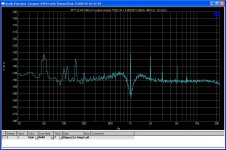
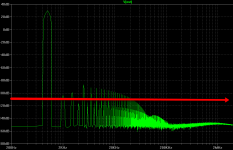
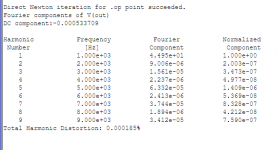
Bias tuning - further analysis
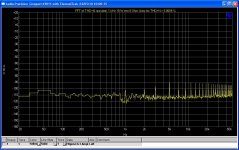
In order for bettering understanding how does the amp perform. The AP output signal distortion residual is also FFT analyzed. The output level is 500 mV as used in above all tests. It can be seen that 2nd, 3rd, 5th and 7th harmonics are present at AP output. They are -131 dBV, -139 dBV, -140 dBV and -145 dBV, respectively. The amp's gain is 27 dB. At the amp's output, the calculated levels will be -104 dBV, -112 dBV, -113 dBV and -118 dBV, respectively. This assumes the amp is perfectly linear. Background noise level will be increased to -123 dBV where AP output is about -150 dBV.
Run the FFT again. Measured levels for no load are -106 dBV, -108 dBV, -113 dBV and -114 dBV. Noise floor level is about -120 dBV. Second harmonic is less than predicted value! Extra third and fifth harmonics are generated by the amp. It agrees well with the theory where 2nd harmonic vanishes for a perfect push-pull output stage.
Levels for 8 Ohm load are -103 dBV, -95 dBV, -104 dBV and -118 dBV. It can be seen that the amp generates more third and fifth harmonics when loaded. Third and fifth harmonics are affected more than the other two.
Attachments
I think Panson has answered your question on why adding crossover distortion to increase the total distortion by just 0.0004% sounds terrible.
"Terrible" is a gross exaggeration when the distortion peaks at -90db. "Harsh" might be a better word (when you base your opinion on the plotted FFT display) or my favourite: "indistinguishable" aka "not perceptible".
In order for bettering understanding how does the amp perform. The AP output signal distortion residual is also FFT analyzed. The output level is 500 mV as used in above all tests. It can be seen that 2nd, 3rd, 5th and 7th harmonics are present at AP output. They are -131 dBV, -139 dBV, -140 dBV and -145 dBV, respectively. The amp's gain is 27 dB. At the amp's output, the calculated levels will be -104 dBV, -112 dBV, -113 dBV and -118 dBV, respectively. This assumes the amp is perfectly linear. Background noise level will be increased to -123 dBV where AP output is about -150 dBV.
Run the FFT again. Measured levels for no load are -106 dBV, -108 dBV, -113 dBV and -114 dBV. Noise floor level is about -120 dBV. Second harmonic is less than predicted value! Extra third and fifth harmonics are generated by the amp. It agrees well with the theory where 2nd harmonic vanishes for a perfect push-pull output stage.
Levels for 8 Ohm load are -103 dBV, -95 dBV, -104 dBV and -118 dBV. It can be seen that the amp generates more third and fifth harmonics when loaded. Third and fifth harmonics are affected more than the other two.
Panson,
You have a fair amount of power supply harmonics in your fft. You can see the harmonics at 50, 100, 150, ect. I would suggest that you first try to eliminate them from your test setup to make sure that they are not related to layout. Here are a few suggestions:
I presume that you are terminating all the grounds at a single point and that point is not the ground at the PS caps;
For my tests I run a heavy gauge wire about 10inch long (25 cm for those who have adopted the imperial system yet) from the PS caps and clip all the leads to the end of that wire forming my star ground;
At this same star ground location I solder a 10 ohm resistor-
To this resistor I connect the ground from the signal output-
The signal ground at the board is connected to the star ground along with the power ground, load ground and signal input(to the AP-1) ground.
I also move my signal input and output wires perpendicular to the DUT as far away from the power supply as possible and keep the signal in and signal out wires as far apart as possible.
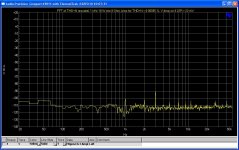
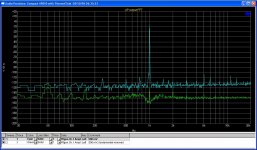
I've attached my latest results from my LME49811 driving my class A/B Allison output shown at about 1watt into 8 ohms. Tested with a Juli@ card which is about 10db noisier than you AP-1 result shown is .0023% THD
It's self biased...
Ken
Attachments
Panson,
I've attached my latest results from my LME49811 driving my class A/B Allison output shown at about 1watt into 8 ohms. Tested with a Juli@ card which is about 10db noisier than you AP-1 result shown is .0023% THD
It's self biased...
Ken
Hi Ken,
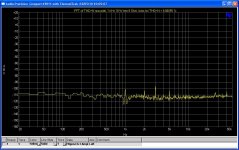
Thank you for you suggestion. If you can do FFT of THD+N residual, you will probably see the hum/harmonics in your system. The hum can be masked in FFT of the output signal.
You can see there is hum in the AP itself. Nothing is perfect. The 50 Hz is about -130 dBV. The amp's gain is 27 dB. From the other FFT of the THD+N residual, the 50 Hz is -103 dBV as indicated by the math -130 + 27. This says no 50 Hz hum is coming other sources. For 100 Hz and its harmonics, they are from the AP and PS ripple.
You should do FFT for higher output power. 1 W is too easy.
Cheers,
Panson
Hi Ken,
Thank you for you suggestion. If you can do FFT of THD+N residual, you will probably see the hum/harmonics in your system. The hum can be masked in FFT of the output signal.
You can see there is hum in the AP itself. Nothing is perfect. The 50 Hz is about -130 dBV. The amp's gain is 27 dB. From the other FFT of the THD+N residual, the 50 Hz is -103 dBV as indicated by the math -130 + 27. This says no 50 Hz hum is coming other sources. For 100 Hz and its harmonics, they are from the AP and PS ripple.
You should do FFT for higher output power. 1 W is too easy.
Cheers,
Panson
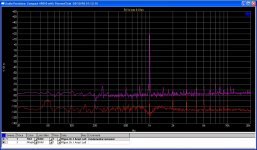
Hi Panson,
I mis-understood your post... I thought the first plot was the AP-1 noise floor and the second the correctly biased scheme output.
Can you post the AP-1 noise floor FFT? Your first plot is 15db below my soundcard noise floor! I've made a few FFTs of higher output power, but am not completely convinced about my methodology... Also in fear for my sound card  How about you, will you post a full power FFT? My simulations show that the harmonics rise considerably with this configuration at full power, it would be interesting to see the actual output.
Regards,
Ken
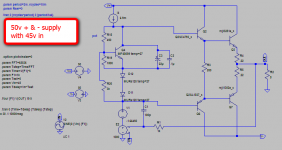
Hi Panson,
Thanks for the plots, I'm still jealous of your AP-1. I don't think I can remove the fundamental with RMAA. I ran my simulation of a similar configuration, which has a "perfect" front end to represent the 49811. The schematic is attached. I didn't calculate the RMS output, just took a swag at it with 50v supplies and 45v signal (which represents the signal voltage coming from the VAS - in this case the 49811). The FFT output is quite similar to your measured results - I drew a line at the -110db level to represent your noise floor. I think you can see that the harmonic content and amplitudes are consistent between the simulation and the actual amp. I also printed the predicted Thd numbers again quite close to your measured .0003 number.
Ken
Attachments
- Home
- Amplifiers
- Chip Amps
- Compact Sized LME49810/11 +ThermalTrak Amp