Re: impulse response
My best guess is that a nice single peak impulse response that does not have much ringing afterwards would be the better performer. I could see the undampened pulse possibly leading to more second order distortion for single woofer tapped horns. For push-pull tapped horns, I guess a poor pulse would mean there would be smearing due to gross amounts of undampened stored energy. I’m glade David was able to add this feature to Hornresponse.
Rgs, JLH
tb46 said:Hi JLH,
quote: "... but is that a good impulse response? What does one look for in a "good" impulse response?"
For a tapped horn it looks quite good to me, actually looks better than the simulated response for the SPUD, but then there is the question, how do they compare in a measurement, and more importantly what do they sound like?
There is always something else to investigate, there may actually be a reason why I have always ended up with dual 15" in sealed boxes.
Regards,
My best guess is that a nice single peak impulse response that does not have much ringing afterwards would be the better performer. I could see the undampened pulse possibly leading to more second order distortion for single woofer tapped horns. For push-pull tapped horns, I guess a poor pulse would mean there would be smearing due to gross amounts of undampened stored energy. I’m glade David was able to add this feature to Hornresponse.
Rgs, JLH
here some information, and a list of drivers suitable for tapped horns.
http://www.t-linespeakers.org/projects/exolinear/rhinos.html
http://www.t-linespeakers.org/projects/exolinear/rhinos.html
kees52 said:here some information, and a list of drivers suitable for tapped horns.
http://www.t-linespeakers.org/projects/exolinear/rhinos.html
A woofer being suitable for quarter-wave use does NOT mean it is suitable for a tapped horn. A tapped horn is NOT a quarter-wave box. A tapped horn works differently than a quarter-wave box. Please do not confuse the two as being the same thing.

Impulse Response
Hi MaVo,
I found this Wikipedia article informative:
http://en.wikipedia.org/wiki/Impulse_response
Regards,
Hi MaVo,
I found this Wikipedia article informative:
http://en.wikipedia.org/wiki/Impulse_response
Regards,
kees52 said:here some information, and a list of drivers suitable for tapped horns.
These are (reverse) tapered quarter-wave tubes (TQWT), AKA tapered quarter-wave pipes (TQWP) and if you fold them up to 'tap' them, those few of us that promote them are calling them TTQWT or T-TQWT, so if you search this forum you should find some examples.
WRT these drivers being suitable for tapped horns, this is true in general, but like any box alignment you want the right driver specs for the app, so when you consider that Fs, Qts defines the driver's max tapped horn gain BW, the ones listed are best suited for true 'sub' duty where the TH's tuning length (Fp) is somewhat below Fs and bass/mid-bass duty in TTQWTs where typically Fp = Fs or higher.
GM
step response
The greatest difference between a SPL graph and a step graph is the information conveyed in the ability of the driver system/enclosure to reproduce a transient. The sharper the rise and fall the "quicker" the system. This is a function that is very dependant on voice coil inductance.
The ringing after the impulse are the box and driver trying to fall to a rest position. Obvious less is more here to.
Properly applied it is a very revealing test. It is akin to the resistance graph where all the wiggles relate to some kind of non-linearity.
I'm on a job site right now. But when I get home I'll post Joe D'Apollito's thoughts from his book on measureing loudspeakers.
What I know I learned from him!
Mark
I resume that I am not dry behind the ears yet.
I do amps more often, but the box itself is still new for me, I have put the link there because it can maybe be of help.
I like the TH-Spud, but then as sub one of them in a stereo because it is efficient enough, and I can make a nice platform of it.
So one th-spub from 10 to 80 hz and then two bassmidd who I can hang on the wall, subtones unther 100 hz has no direction so it will have no impact on stereo.
oke thanks
dan I will go lower, it is not a problem.
the most difficult part are the sub-bas, and with a tapped
horn I can fill that.
only I will temper the Efficiency somewhat to get it equal with the bass-mid, I believe this can by make th mouth narrower..
regards kees
dan I will go lower, it is not a problem.
the most difficult part are the sub-bas, and with a tapped
horn I can fill that.
only I will temper the Efficiency somewhat to get it equal with the bass-mid, I believe this can by make th mouth narrower..
regards kees
AndrewT said:10 to 80Hz is three octaves...........that will be massive.
Yeah, just calculating a theoretical 15" driver suitable for a ~3:1 CR to save time yields a ~913 L net cab which once damped should cover at least three octaves at reasonable efficiency:
GM
Attachments
Hey GM I notice that you and also HornsKeith used slightly different parameters for the LMS driver in your simulations. Any reason for this in particular?
Unless there is something better I will start looking at determining the folding scheme and general cabinet design for the 600L version I posted earlier. This should be fun...
Unless there is something better I will start looking at determining the folding scheme and general cabinet design for the 600L version I posted earlier. This should be fun...
Re: Impulse Response
Thanks tb46. The article speaks of measured impulse responses which can reveal where the speaker differs from the ideal model. Yet, i asked about a simulated impulse response, where all the artefacts that this article refers to wont be in.
To my knowledge, every impulse response shows a rise and fall before and after the spike, which are there because the speaker is allways a bandpass system. Then you have the small irregularities which can be identified with frequency response bumps. Basically, one can translate from one to the other, only that the frequency response shows the data in a more usefull manner.
Or did i miss something?
tb46 said:Hi MaVo,
I found this Wikipedia article informative:
http://en.wikipedia.org/wiki/Impulse_response
Regards,
Thanks tb46. The article speaks of measured impulse responses which can reveal where the speaker differs from the ideal model. Yet, i asked about a simulated impulse response, where all the artefacts that this article refers to wont be in.
To my knowledge, every impulse response shows a rise and fall before and after the spike, which are there because the speaker is allways a bandpass system. Then you have the small irregularities which can be identified with frequency response bumps. Basically, one can translate from one to the other, only that the frequency response shows the data in a more usefull manner.
Or did i miss something?
Impulse Response
Hi MaVo,
It is my understanding, that in a frequency response plot you are looking at two curves: 1. magnitude, and 2.phase.
The impulse response displays the reaction of a system to a stimulus against time, and the aspects of the frequency response can be derived from this reaction. The impulse response shows the relative magnitude and arrival times of the pressure wave(s) as well as the reflections and ringing produced by chambers, ducts and horns in the time domain, something I don't think you can get from the SPL and phase response bode plots.
I'm more than willing to confess, that the math involved is well out of my range, and thus I have to refer you to the reams of information on the net. Just chasing down some of the references in the wikipedia article has my head hurting.") Basically, I look at it as one more wrench in the tool box.
Basically, I look at it as one more wrench in the tool box.
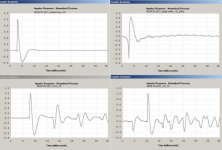
I'll attach a number of Hornresp impulse response curves for the MCM 55-241 in 1 cubic foot enclosures: closed, bass-reflex, front-loaded horn and tapped horn. I cannot get the same information from frequency response curves, and am trying to understand what it means in reference to subwoofers and particularly tapped horns.
Regards,
Hi MaVo,
It is my understanding, that in a frequency response plot you are looking at two curves: 1. magnitude, and 2.phase.
The impulse response displays the reaction of a system to a stimulus against time, and the aspects of the frequency response can be derived from this reaction. The impulse response shows the relative magnitude and arrival times of the pressure wave(s) as well as the reflections and ringing produced by chambers, ducts and horns in the time domain, something I don't think you can get from the SPL and phase response bode plots.
I'm more than willing to confess, that the math involved is well out of my range, and thus I have to refer you to the reams of information on the net. Just chasing down some of the references in the wikipedia article has my head hurting.
Basically, I look at it as one more wrench in the tool box.I'll attach a number of Hornresp impulse response curves for the MCM 55-241 in 1 cubic foot enclosures: closed, bass-reflex, front-loaded horn and tapped horn. I cannot get the same information from frequency response curves, and am trying to understand what it means in reference to subwoofers and particularly tapped horns.
Regards,
Attachments
GM said:I always input the basics and let HR calculate/optimize as required since even measured specs can be off if for no other reason than the measurement program can have some different constants such as air mass (po) and speed of sound (SoS) than the simming program.
GM
What do you consider the basics? I've always considered BL, RE, MMS, to be the most concrete parameters driver to driver. Vas, Q's,FS and the like float around substantially.
layertone said:
I will certainly chime in with some photos soon with my Lab12. I'm using 3/4" apple ply. Decided to use a 12x14x1/2" Green edge clear acrylic for a driver access panel (also able to see the lab12)
Thanks
I'm chiming in as promised!!!
http://www.diyaudio.com/forums/showthread.php?s=&threadid=143714
2100 sq cm of mouth area in a FLH will never get flat response down to 10Hz, even with corner loading.GM said:calculating a theoretical 15" driver suitable for a ~3:1 CR to save time yields a ~913 L net cab which once damped should cover at least three octaves at reasonable efficiency:
Re: Impulse Response
The closed box gives best response.
The reflex is less good and out of phase.
The tapped horn is the worst.
Why all the ripples and delayed decay from the font loaded horn?
Am I reading the displays correctly?tb46 said:The impulse response displays the reaction of a system to a stimulus against time, ,
The closed box gives best response.
The reflex is less good and out of phase.
The tapped horn is the worst.
Why all the ripples and delayed decay from the font loaded horn?
- Home
- Loudspeakers
- Subwoofers
- Collaborative Tapped horn project