Xo curves are not from the book - dipole function and directivity issues must be concidered! There is a lot of things to do better and I hope that the narrower MTM baffle helps a bit to even out dispersion around 3kHz.
Beyma was fixed!
Beyma was fixed!
Attachments
Last edited:
After the dinner I went back to basics:
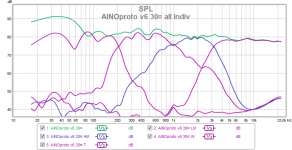
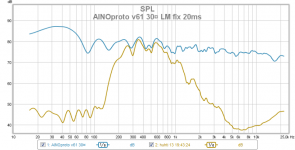
- phase tracking check with inverted phase etc. and some thinking - and v61 was born
W 220Hz LR24dB
LM 800Hz LR24dB
HM 3200Hz BW30dB
Even better response and perhaps better directivity control
Sorry, I use differents scales and I forget what I showed you previously. But this is just a hobby
- phase tracking check with inverted phase etc. and some thinking - and v61 was born
W 220Hz LR24dB
LM 800Hz LR24dB
HM 3200Hz BW30dB
Even better response and perhaps better directivity control
Sorry, I use differents scales and I forget what I showed you previously. But this is just a hobby
Attachments
Last edited:
Together with the lower Xover frequency this should help.Rudolf, I am about to make a new proto2 baffle of a floor laminate board, 100mm wide and 8mm thick. The MDF board the proto1 has is 16mm.
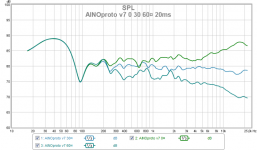
AINOproto v7 done and measured!
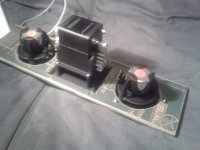
First post will show pictures of the new MTM baffle
Floor labinate board, HDF 8mm thick, width 100mm. Edfes and driver holes chamfered. Drivers closer to each other M toM distance 200mm, The board was a leftover from kitchen renovation 10 years ago!
First post will show pictures of the new MTM baffle
Floor labinate board, HDF 8mm thick, width 100mm. Edfes and driver holes chamfered. Drivers closer to each other M toM distance 200mm, The board was a leftover from kitchen renovation 10 years ago!
Attachments
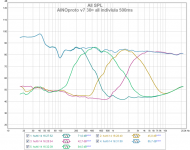
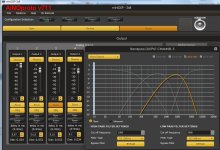
Some measurements with Room Equalization Wizard a wonderful and versatile audio/spaker/room analyzation and equalization program by John Mulcahy! It is free but please join me to be a supporting member - donate!
I am thankful to Rudi for guiding me in right direction!
W xo 210Hz LR24dB to
LM xo 1150Hz LR34dB to
HM xo 3000Hz LR24 to
T
PEQ and delay were adjusted too. Phase matching as well as I can
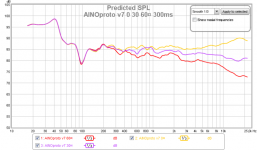
The result is very close to what I imagined I could achieve with my physical design criteria.
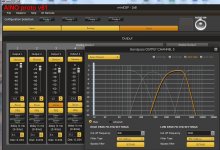
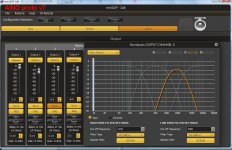
XO pics
I am thankful to Rudi for guiding me in right direction!
W xo 210Hz LR24dB to
LM xo 1150Hz LR34dB to
HM xo 3000Hz LR24 to
T
PEQ and delay were adjusted too. Phase matching as well as I can
The result is very close to what I imagined I could achieve with my physical design criteria.
XO pics
Attachments
Last edited:
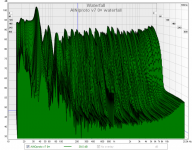
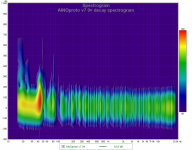
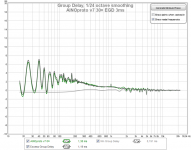
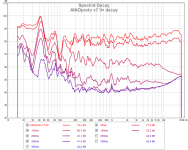
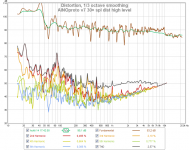
AINOproto v7 EGD and decay, spectrogram
(distortion plots seem to show only my ambient nose level, same elvel as before,,)
(distortion plots seem to show only my ambient nose level, same elvel as before,,)
Attachments
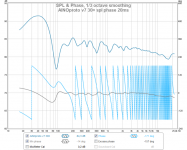
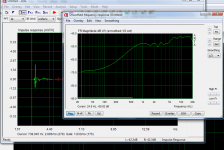
AINOproto v7 and ARTA!
I have not registered ARTA, I can not do a diectivity spectrogaram, sorry!
I don't know how to interprete these , do they show something that REW doesn't?
I have not registered ARTA, I can not do a diectivity spectrogaram, sorry!
I don't know how to interprete these , do they show something that REW doesn't?
Attachments
-
 AINOproto v7 imp and amp resp 1,83ms.png122.2 KB · Views: 93
 -
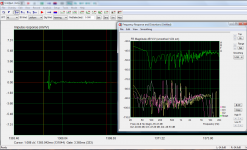 AINOproto v7 distortion.png162.6 KB · Views: 78
 -
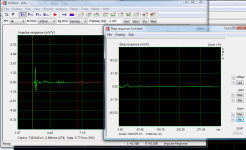 AINOproto v7 step resp.png112.7 KB · Views: 77
 -
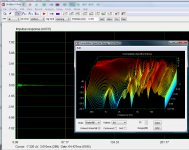 AINOproto v7 CSD.png173.7 KB · Views: 91
 -
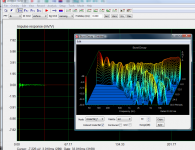 AINOproto v7 burst decay.png159.7 KB · Views: 89
 -
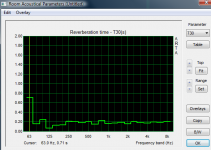 AINOproto v7 T30.png45.7 KB · Views: 82
 -
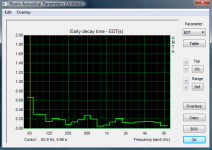 AINOproto v7 EDT.png54.2 KB · Views: 64

Juhazi,
I like what I see.
The off-axis response in the 2 kHz area looks much better now. And I like the symmetric bandpass filters better than the v6 filters.
Since I measure with ARTA, a few comments about your ARTA measurements:
The impulse responses are too noisy right from the start. You should see at least a few milliseconds of straight line after the initial impulse before reflections set in. This noise will be the reason for the dissapointing distortion diagram. You want to have 40 dB between the frequency response and the distortion lines - as in your own program.
For the T30 and EDT diagrams let the y-axis range end at 1.00 or 0.50. 2.00 is too much to see any detail.
Rudolf
What happened to the 90° response of the midrange drivers?AINOproto v7
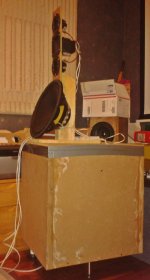
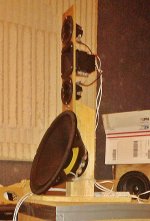
Front and back without W !
I made still some more fine tunig - v71
- W to LM slopes (PEQ)
- HM to T slopes (PEQ)
- xo frequencies
When doing software tuning it is wise to take a pause often and change settings for graphs:
- IR window
- smoothing
- graphic scale
And then again when it starts to look good, check:
- phase matching by reversing polarity of drivers
- group delay graphics
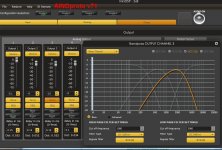
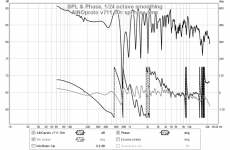
AINproto v71
dipole funtion/slopes used in advantage again
notice difference between software xo and measured acoustical xo
- a little more raggedness but less biquad calculations!
dipole funtion/slopes used in advantage again
notice difference between software xo and measured acoustical xo
- a little more raggedness but less biquad calculations!
Attachments
Last edited:
Yes, I know that the noise is too high (relatively) in my measurements. But I have to limit the level because there are 4 people living here! During the weekend I must have done hundreds of sweeps! Only once I used level of ~90dB. Also, the air ventilation system and desktop computer should be shut down when doing "hard core" measurements!
The LM woofer might have been muted during the 90¤ measurement - it happens easily with minidsp plugin.
I have heard that one will learn from mistakes. Does that mean that the more mistakes you make, the more you will learn? I hope so...
The LM woofer might have been muted during the 90¤ measurement - it happens easily with minidsp plugin.
I have heard that one will learn from mistakes. Does that mean that the more mistakes you make, the more you will learn?
I hope so...p.s. I was informed that I will soon receive 15" Dayton drivers for my HT subs and a tuned motor for my Thorens TD145 AND (most important) new stator for my vintage Yamaha SRX-6 cafe racer!
The spring has come! Grey gulls and blackbirds are back!
The spring has come! Grey gulls and blackbirds are back!
I think I know now where the problems between 200 and 800Hz come - MY ROOM!
I have tried various things except moving the system to another room!
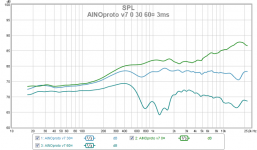
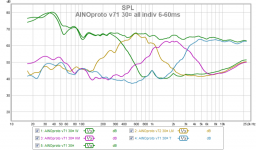
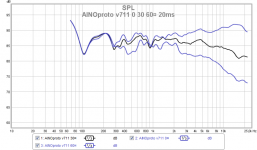
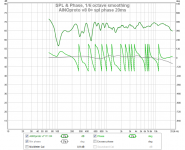
Today I continued with v7 and came to v711, the "time aligned and musical (PRAT) version"
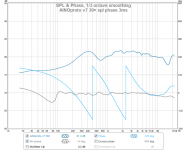
Xo slopes utilize dipole slopes and are thus not symmetrical in software but symmetrical in acoustic measurements.
Software slopes are unsymmetrical, xo (also some PEQ used except for T)
W 200/LR12
LM 260/LR12 and 1000/LR24
HM 1000/LR12 and 300/LR24
T 3000/LR24
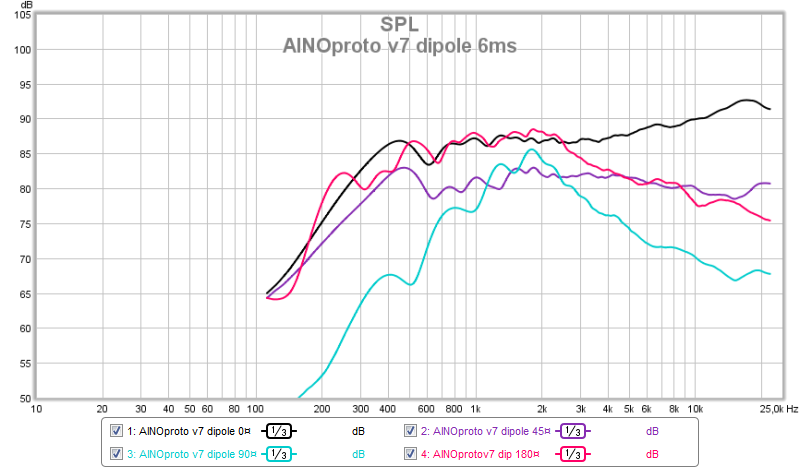
Acoustic slopes are all around LR24dB, xo 350Hz, 1050Hz and 2700Hz
Very nice phase match!
Directivity is very good, gradually narrowing to the high end, with the exception of obviously my measuring room interferences/reflections! This makes me do outdoor measurements when the weather and songbirds allow it!
I have tried various things except moving the system to another room!
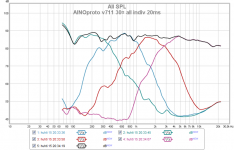
Today I continued with v7 and came to v711, the "time aligned and musical (PRAT) version"
Xo slopes utilize dipole slopes and are thus not symmetrical in software but symmetrical in acoustic measurements.
Software slopes are unsymmetrical, xo (also some PEQ used except for T)
W 200/LR12
LM 260/LR12 and 1000/LR24
HM 1000/LR12 and 300/LR24
T 3000/LR24
Acoustic slopes are all around LR24dB, xo 350Hz, 1050Hz and 2700Hz
Very nice phase match!
Directivity is very good, gradually narrowing to the high end, with the exception of obviously my measuring room interferences/reflections! This makes me do outdoor measurements when the weather and songbirds allow it!
Attachments
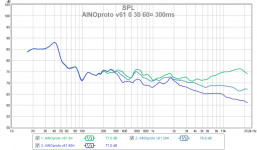
Why don't you stay with 6 ms instead of 20 ms, when in the room? That should keep you inside the no-reflections window.Directivity is very good, gradually narrowing to the high end, with the exception of obviously my measuring room interferences/reflections!
I do all measurements inside and mostly windowed. Below 500 Hz they don't tell me much about the primary design, because the window is too short. But in that range the output follows simulations reliably and is spoiled by room modes anyway.
Rudolf
- Home
- Loudspeakers
- Multi-Way
- Aino gradient - a collaborative speaker project