The Woofer Tester II or the WT3 are the fastest and easiest way, if you have one. I find it very handy-dandy. Also does t/S parameters, which is a big help when designing.
Thanks guys.
Wow that is some wild software. Good price as well.
For measuring impedance I have installed Audacity today. The idea is to use Audacity to generate my test tones. The Audacity interface was easy enough to use, but my single frequency tones and tone sweeps had an annoying extra tone or buzz (perhaps a few kHz), although my frequency meter was reading the correct, predominant tone. Nothing else was running. As a sanity check I went back to foobar and the tones I created sounded pure.
After a bunch of trial and error in Audacity I found that the setting for Audio Host in the Device Toolbar is what caused the problem. The default setting was "MME" and the setting that seems to work to give a single tone is "Windows DirectSound". Any reason not to choose "Windows DirectSound"? Windows 7 Pro is what I'm running.
Other than that problem Audacity seems to have what I need to get started. I also have Cooledit and SoundForge but my versions are way too old to run in Windows 7.
Edit: Oh, and when generating a swept tone (which Audacity calls a "Chirp") is it better to use "linear" or "logarithmic" for the setting of Interpolation?
Last edited:
I read through this whole thread. I feel that it is incomplete. What Tom Danley says is correct. With a better system (less distortion system), you actually hear a lot louder than with a poorer system. The amp power is only correct for that particular complete system. If you upgrade the weakest link in the system (not necessarily the speakers), you might actually crank up the volume more and then you need even more power with possibly the same speakers.
What pano is measuring:
The ear doesn't hear loud music per se as mentioned earlier, it hears loud noise
What pano is measuring:
The ear doesn't hear loud music per se as mentioned earlier, it hears loud noise
That is true, you'll turn up a cleaner signal more. But if you have thoroughly read thru the thread - it's a lot of posts, I know - then you will see this mentioned over and over. If you do the test and find that you are close to your amp's clipping point, then you need a bigger amp. You can do the test again with a bigger amp. Don't forget that the test is supposed to be done at a much higher volume (your personal max) than normal. Most listening will be done at lower levels.
Most of the people who have taken the test were far below clipping on their amps. Unless those amps get really nasty far below clipping (possible), then they would not have turned up the volume more. In domestic situations, the room, the wife and the neighbors are often the limiting factor.
If you are running a disco or a PA, then this test might not be for you. But for domestic Hi-Fi listening it does just fine. If you are close to the limits of your amp, then you should get a bigger amp. That's the whole point of this test.
Speaker Impedance Measuring
I'm making some progress in measuring the impedance of the B&W 801 as discussed in earlier posts. Here is my procedure:
I installed an Ohmite 17FPR040E 7w, 0.04 ohm, four terminal current sense resistor in series with the ground leg of one speaker.
I used a 20Hz-20kHz swept tone from Audacity to excite the speaker. The average voltage at the output of the amp was 8.446 v, 30Hz-5kHz. The voltage level dropped down to 7.687 v at 18kHz (possibly because of meter frequency response) but I ignored this and used 8.446 v for my calculations.
With no signal I had 0.53 mv of noise across the Kelvin connections of the current shunt. During the frequency sweep I measued 9364 voltage data points across the Kelvin connections of the current shunt, and subracted the 0.53 mv of noise. From Ohm's law I calculated the current at each data point, and then the impedance of the speaker at each point.
Attached is, I hope, the first version of my Excel impedance graph. I am an Excel novice, and I have not yet figured out how to make the x axis reasonable. As it stands the x axis is the row number of the impedance data point. I'd like for the x axis to be logarithmically labeled 20Hz-20kHz. Maybe there is an Excel function to generate a column of such numbers? Anyone have suggestions? Either with Excel or with my methods?
Also, this is the first time I have tried a file attachment here so please be merciful.
Edit: I forgot the conclusion. I conclude that my Crown D-75A would not work that well in bridged mode with the B&W 801.
Attachments
Last edited:
Tonight I reworked my B&W 801 impedance graph. To get the y axis values I cheated: I wrote a logarthmic function in Excel to generate my frequency data points.
I wish I had some better graphing software than Excel, but here is my best graph so far...
http://www.tribade.org/audio/B&W 801 Impedance 09172012.pdf
I wish I had some better graphing software than Excel, but here is my best graph so far...
http://www.tribade.org/audio/B&W 801 Impedance 09172012.pdf
If it wasn't clear, I'm using linear for the impedance axis and log for the frequency axis. I generated the frequency axis data with the formula:
=POWER(10,LOG10(20)+((LOG10(20000)-LOG10(20))/9364)*ROW(1:9365)-1))
Audacity uses a similar formula to generate the logarithmic swept tone which they call "chirp". I spot checked the actual swept tone with a frequency meter.
What I have not yet been able to do in Excel is make the data points smaller. To me they look like large filled circles. I've not been able to label the impedance axis without crashing Excel, and I can't get a label to show up on the frequency axis. I'd also like to be able to make the graph much larger so I could better visualize the 9364 data points. But I am learning.
What is it you're trying to achieve Lavcat..? Impedance magnitude and phase..?
I'd like to measure phase but I don't know how to do it with what I have.
lav,
you don't need to generate the log values. Excel already log scales for either, or both axes in the options.
Unless I am missing something, it was necessary to generate the log frequency values, whether the frequency axis was displayed linearly or logarithmically. Otherwise the impedance points would not match up with the proper frequencies!
Consider the impedance peak at 1884 Hz. If the frequency points were a linear sequence rather than a log sequence the 1884 Hz peak would appear at about 13,170 Hz, no matter where 13,170 Hz was located on x axis.
Just as a sanity check I did this test again tonight with a level that is not super loud, but as loud as I normally listen. (plenty loud) Got 0.58V on the 120Hz signal.
That puts me at 2.3 volts RMS max voltage I need at that volume setting. Obviously, I have efficient speakers. I need current gain more than voltage, really. That would change fast with less efficient speakers and/or a larger space.
That puts me at 2.3 volts RMS max voltage I need at that volume setting. Obviously, I have efficient speakers. I need current gain more than voltage, really. That would change fast with less efficient speakers and/or a larger space.
The absolute maximum my system (now) gets pushed to is about 120w/ch into the woofers. It doesn't go any louder as the clipping lights come on at that point. I believe that comes out just above 20v.
The only reason it gets pushed that far is for a party in the flat. The cone excursion on the TB 6.5" mini-subs is rather impressive, though (being concerned about damaging them) I'll be sorting out a proper subwoofer in the (hopefully) near future.
Chris
The only reason it gets pushed that far is for a party in the flat. The cone excursion on the TB 6.5" mini-subs is rather impressive, though (being concerned about damaging them) I'll be sorting out a proper subwoofer in the (hopefully) near future.
Chris
Just as a sanity check I did this test again tonight with a level that is not super loud, but as loud as I normally listen. (plenty loud) Got 0.58V on the 120Hz signal.
That puts me at 2.3 volts RMS max voltage I need at that volume setting. Obviously, I have efficient speakers. I need current gain more than voltage, really. That would change fast with less efficient speakers and/or a larger space.
Yes, perhaps you need 2.3v RMS to get 120Hz to the loudest it gets at your normal volume level.
If this is taken as estimate for every other frequency reproduced by the speaker, then what happens when you need 10 or 20 frequencies to be as loud simultaneously?
At a certain point in time all these frequencies could also be perfectly in phase.
Regards,
Andrew
From your question I can only deduce that you don't understand digital recordings. (A lot of people don't) The subject has been explained again and again in this thread. But I'm not embarrassed to repeat myself. ")
Digital recordings have an absolute maximum level, it's called 0dBFS. The FS stands for Full Scale. No level can ever be higher than that unless there is a fault in the DAC - and then it's maybe just be a few dB of ringing. It does not matter if I need 10, 20 or 2210 frequencies simultaneously, the highest value will never be more than 0dB. Even an infinite number of frequencies in phase could never be higher than 0dBFS, that is the maximum level encoded into a digital signal. On the analog outputs of most consumer DACs that's 2.83 volts peak, or 2V RMS. That's the ceiling, the top level possible to record, the chip has no way of going higher. Not with one frequency, 2 frequencies or 400 frequencies. The DAC doesn't care about frequencies, it just cares about levels.
Now that we know the ceiling, we know that all other levels most be lower. Therefore we know from the measurement of my reference tone which is 12dB RMS below peak, what the maximum peak value will be (4X the measured voltage). A sinewave at maximum level would be -3dBFS RMS. Its peaks are at 0dB, but its RMS value is -3dB.
It all falls into place once you understand how digital recordings work. Analog sources are not so neat and tidy, but even tape or vinyl playback has a maximum level. It's just not as well defined as the maximum level of a digital source.
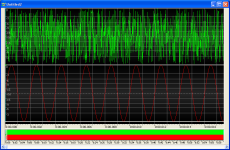
A picture is worth 1000 words, so here's a couple of pictures that should explain digital levels better than I did above.
On the first one we have white noise at the top and a full volume sinewave at the bottom. Both peak at 0dB, that's as high as they can ever go. The sinewave contains just one frequency (here 500Hz). The white noise contains (in theory) an infinite number of random frequencies. The sine has an RMS value of -3dB below peak. The white noise, about 4.5dB below peak.
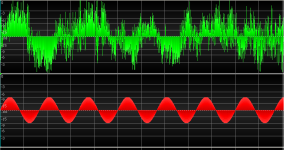
On the second we see a pop song with heavy compression. It's very squashed and has an RMS value 8.5dB below peak. I.E. Loud!! Below it is the 120Hz reference tone. You can see that it's peaks are at -9dBFS, thus its RMS value is -12dBFS. You can also see that there is nowhere for them to go above 0dB. That's as loud as the signal can ever get, no matter what its form.
On the first one we have white noise at the top and a full volume sinewave at the bottom. Both peak at 0dB, that's as high as they can ever go. The sinewave contains just one frequency (here 500Hz). The white noise contains (in theory) an infinite number of random frequencies. The sine has an RMS value of -3dB below peak. The white noise, about 4.5dB below peak.
On the second we see a pop song with heavy compression. It's very squashed and has an RMS value 8.5dB below peak. I.E. Loud!! Below it is the 120Hz reference tone. You can see that it's peaks are at -9dBFS, thus its RMS value is -12dBFS. You can also see that there is nowhere for them to go above 0dB. That's as loud as the signal can ever get, no matter what its form.
Attachments

- Home
- Loudspeakers
- Multi-Way
- A Test. How much Voltage (power) do your speakers need?