Superb! You will probably get this one finished before I assemble my analogue tracer! Anyway, more than happy to follow your steps again on this!
Cheers
Ale
Cheers
Ale
It was pretty easy to create a simple API to control the AD7808 in the Arduino kit. I used the soft SPI that just does "bit-banging" and measure about 300 uS to load and output a single channel. Since loading the DAC is outside the measurement pulse, it should be no problem. Setting up 3 or 4voltages will take about a millisecond. I'm shooting for about 100 points per second overall.
Attachments
Just read through the whole thread, very interesting.
I have a few thoughts about this. On the PC side I personally would go with a web application instead of creating a GUI in C++ or any other programming language. This makes it easier for others to play with the code without having to recompile the source code with specific tools. You can create a good GUI with open source tools, one could for example use Google Chart Tools. All data received from the Arduino would be written to a database (MySQL, Postgres, etc...). If you prefer to use spreadsheet, you can always export CSV values from the database.
Will there be a project web site somewhere to exchange ideas? Something more than this thread at least?
Just read through the whole thread, very interesting.
I have a few thoughts about this. On the PC side I personally would go with a web application instead of creating a GUI in C++ or any other programming language. This makes it easier for others to play with the code without having to recompile the source code with specific tools. You can create a good GUI with open source tools, one could for example use Google Chart Tools. All data received from the Arduino would be written to a database (MySQL, Postgres, etc...). If you prefer to use spreadsheet, you can always export CSV values from the database.
Will there be a project web site somewhere to exchange ideas? Something more than this thread at least?
Today I'm hand-wiring a little breadboard regulator to do limited triode testing and tracing just to get a good solid base of the arduino code going and to play with a few different regulator ideas. Then I'll make a PCB for the regulator and build a full unit.
I haven't given much thought to the PC side of things. Personally I would like a mode where there are canned tests for some common tube types, plus a mode where I can algorithmically vary parameters alone and in combination for custom tracing.
A scripting mode is probably how I will start, with a python interface on the PC talking to the arduino using parameter sets passed to the tester and result sets and lists passed back to the PC. The python interface woud have the right hooks for GUI control and charting output.
Perhaps along the line that you are thinking of, check out locky_z's transistor curve tracer, it has many pre-defined test options, the UI even got that vintage 90's Windoz look... 😀
http://www.diyaudio.com/forums/solid-state/151253-diy-curve-tracer-pc.html
Looking forward to this tester, I think you got something great here!
Jaz
http://www.diyaudio.com/forums/solid-state/151253-diy-curve-tracer-pc.html
Looking forward to this tester, I think you got something great here!
Jaz
The µTracer
This might be of some interest as well.
The µTracer, a miniature Tube Curve Tracer / Tester. It also utilizes pulse mode measurement, current version 3.0 The uTracer, a miniature Tube Curve Tracer / Tester.
The UI looks like this.
Jaz
This might be of some interest as well.
The µTracer, a miniature Tube Curve Tracer / Tester. It also utilizes pulse mode measurement, current version 3.0 The uTracer, a miniature Tube Curve Tracer / Tester.
The UI looks like this.
An externally hosted image should be here but it was not working when we last tested it.
Jaz
Agilent B1505
Even the super high-end Agilent tester has so so UI:
Jaz
Even the super high-end Agilent tester has so so UI:
An externally hosted image should be here but it was not working when we last tested it.
Jaz
First trace
Collected using the hand wired test regulator, 10V plate steps, 2V grid steps, CSV output, serial capture, spreadsheet plotting.
Actual code that ran on the Arduino to collect the traces
...
for (Vg1 = Vg1_start; Vg1 <= Vg1_stop; Vg1 += Vg1_step) {
for (Vplate = Vplate_start; Vplate <= Vplate_stop; Vplate += Vplate_step) {
write_ad7808_dac(Vplate_ctrl, Vp_counts(Vplate) ); //Setup plate voltage for this step
write_ad7808_dac(Vg1_ctrl, Vg1_counts(Vg1) ); //setup grid voltage for this step
load_all_ad7808(); // turn on outputs for step
delay(settling_delay); // wait a milli
Iplate = Ip_mA(analogRead(Iplate_sense) ); //read the plate current
clr_all_ad7808(); // drop plate and grid voltage
Serial.print(Vg1); // spit the reading out for capture
Serial.print(",");
Serial.print(Vplate);
Serial.print(",");
Serial.print(Iplate);
Serial.println();
delay(step_delay);
if(Iplate * Vplate >= VIplate_limit) break; // check to see if this curve is done
}
}
Attachments

Last edited:
Congrats!
How long did it take to collect the data (not counting spreadsheet import/plot)?
Jaz
How long did it take to collect the data (not counting spreadsheet import/plot)?
Jaz
Last edited:
Congrats!
How long did it take to collect the data (not counting spreadsheet import/plot)?
Jaz
That set went from -28 to 0 volts on the grid by 2V steps and 0 to 250V on the plate by 10V steps. 15 * 26 = 390 points in about 6 seconds. A lot of the time is in serial output at 9600, which can speed up a lot, and there is an extra 1-2mS per point delay. Conversely, there will need to be more stuff in the loop eventually but I'm greatly encouraged by this result. 100 points per second is my rough expectation for pentode plate curve generation, with about 1000 points needed for a good set of curves.
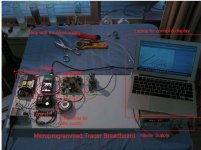
Here's the breadboard setup. I wired a programmable regulator with floating output and return path sensing, plus a simple grid driver consisting of a level shifted opamp. There is a small SMPS for the 3V3, 5V, and +-15V, a little 40V DC power supply for the grid drive, and a 10VA toroid for the 300V plate supply. Since the measurement only takes a millisecond, I can use a tiny plate supply with a storage capacitor to supply practically any plate current needed.
Attachments
That set went from -28 to 0 volts on the grid by 2V steps and 0 to 250V on the plate by 10V steps. 15 * 26 = 390 points in about 6 seconds. A lot of the time is in serial output at 9600, which can speed up a lot, and there is an extra 1-2mS per point delay. Conversely, there will need to be more stuff in the loop eventually but I'm greatly encouraged by this result. 100 points per second is my rough expectation for pentode plate curve generation, with about 1000 points needed for a good set of curves.
Michael,
If you plan on drawing curves that abuse tube ratings you may want to just write values to memory during the acquisition phase and handle communication with the computer between sweeps to make the sweeps faster. Just a thought.
what about an analog XY writer ? to capture curves ?
they are cheap when you can get them. some even carry galvanic insulation
feed the Y axis the differential voltage over a sense resistor .
feed the X axis the anode voltage from a simple divider network
interface the grid voltage
use a stepper controlled pot to sweep the HV . insulating the HV in one go .
just some thoughts
Michael,
If you plan on drawing curves that abuse tube ratings you may want to just write values to memory during the acquisition phase and handle communication with the computer between sweeps to make the sweeps faster. Just a thought.
Thanks, that would be a speed optimization to consider. One question to think about is how fast is it necessary to capture traces?
I've noticed that virtually all of the published tube curves extend beyond the datasheet maximum ratings. They also mention the use of pulse measurement techniques so as not to exceed the datasheet maximum operating conditions. I don't consider it abuse. The measurement doesn't stress the tube to the point of insulation breakdown (at least not intentionally) nor does it subject anything to severe stress. It's a lot safer than the sweep based testers in terms of tube stress.
what about an analog XY writer ? to capture curves ?
they are cheap when you can get them. some even carry galvanic insulation
feed the Y axis the differential voltage over a sense resistor .
feed the X axis the anode voltage from a simple divider network
interface the grid voltage
use a stepper controlled pot to sweep the HV . insulating the HV in one go .
just some thoughts
I remember some voltage regulators I used to work on that had motor driven variacs. That would probably work ;-)
I didn't mean to imply that you were abusing the tube, only that I would if I were you😀. Since max DC plate voltage for 6NS7 is 450V, I would run curves out to 900V and out to quite a bit over max dissipation. If it takes you almost half a second to sweep to 250V, it will take almost two to sweep to 900V. Is that bad? I don't know. How slow can the pulse be before you can no longer model this as an average dissipation? I guess it depends on the size of the plate. Maybe I am worrying about nothing.
I'm only suggesting that faster is better since it is basically free.
Good work, by the way.
I'm only suggesting that faster is better since it is basically free.
Good work, by the way.
You don't have to take readings monotonically.
Dither it.
Take the lowest dissipation sample, then the greatest dissipation sample, take the second lowest, take the second highest.....
Dither it.
Take the lowest dissipation sample, then the greatest dissipation sample, take the second lowest, take the second highest.....
Pulse mode curve capturing might have its limitations.
As the curves are taken at a relatively low frequency interval time is quite high . Meaning that a tube has enough time to regenerate its electron cloud between intervals.
If you where to capture curves in real static DC conditions. I think the curves would hardly look alike
The curves could be a good indication of a worn tube. As a tube whit good emission could sustain higher anode current . Over longer periods of time . (seconds instead of milliseconds )
Please correct me if im incorrect. I'm in a learning curve😀
v4lve
Pulse mode curve capturing might have its limitations.
As the curves are taken at a relatively low frequency interval time is quite high . Meaning that a tube has enough time to regenerate its electron cloud between intervals.
If you where to capture curves in real static DC conditions. I think the curves would hardly look alike
The curves could be a good indication of a worn tube. As a tube whit good emission could sustain higher anode current . Over longer periods of time . (seconds instead of milliseconds )
Please correct me if im incorrect. I'm in a learning curve😀
v4lve
time to regenerate it's electron cloud?
I can't relate to that. do you have a reference for what you mean by regenerating the electron cloud and how long it might take?
A tube with a good cathode can produce good cathode current. I don't know how that relates to time either. I think pulse measurement will detect that as well as continuous measurement, without subjecting good tubes to needless heat stress.
There might be some use in running a tantalum/zirconium anode tube hot enough to activate the getter during testing, but that's sort of a different issue.
- Status
- Not open for further replies.
- Home
- Design & Build
- Equipment & Tools
- A micro-programmable tube tracer/tester