Yes I have it, Peerless DFM 2544R..Do you still have the peerless CD?
")
But I think the measurements of this horn with that Peerless driver (or a similar one) are already available on the ATH thread..
I am most curious about the SB audience Rosso driver performance on this horn..
I took some measurements of the BMS 4550 CD on EXAR 400 horn today
Measurements taken 1m away from horn mouth (gated at 4.1ms)

On axis frequency response and impedance measurement together

VituixCAD plots
Normalized directivity computed with reference axis as 10 degrees off axis

Measurements taken 1m away from horn mouth (gated at 4.1ms)
On axis frequency response and impedance measurement together
VituixCAD plots
Normalized directivity computed with reference axis as 10 degrees off axis
Here is the data for SB audience Rosso 65CDN-T 1.4inch exit CD on the EXAR 400 with a 3D printed throat insert to make it a 1inch exit
In below plots, please ignore the absolute SPL levels. The seem low around 50 to 60dB SPL in plots since I had not done SPL calibration for the mic (ISEMcon EMX-7150). In reality they should be hanging around at least 80+ dB
Angular measurements upto 90 degrees

On axis response + impedance curve

VituixCAD plots

I just wish that break up was a bit milder.. (Obviously, not because I can hear it, but just so that it might look nicer to the eyes )
In below plots, please ignore the absolute SPL levels. The seem low around 50 to 60dB SPL in plots since I had not done SPL calibration for the mic (ISEMcon EMX-7150). In reality they should be hanging around at least 80+ dB
Angular measurements upto 90 degrees
On axis response + impedance curve
VituixCAD plots
I just wish that break up was a bit milder..
(Obviously, not because I can hear it, but just so that it might look nicer to the eyes )I had been kept out of audio activities again due to work and family health issues.
But today morning I got some free time and I quickly cobbled up a quick system out of my Satori WO24P-8 woofers & the SB audience Rosso 65CDN-T.
DSP active two way with DSP and amp duties handled by the Zoudio board (https://zoudio.com/)
Here is quick view of specs (ignore the amp gains on crossover pic below)


How does it sound like..?
Here are two quick video clips shot on my mobile phone from close to MLP
Please be careful with volume )
I hope this at least gives a vague idea of the system performance.
In real-life listening, the system blows the socks and then some other things off even at low volumes (as in the video).
The system is just cruising and has incredible dynamics and clarity.
Just mindblowing
Well, I may need to take care of some room modes and a bit of fine tuning.. but that is work for another free day. As of now, I am really enjoying what I am hearing
But today morning I got some free time and I quickly cobbled up a quick system out of my Satori WO24P-8 woofers & the SB audience Rosso 65CDN-T.
DSP active two way with DSP and amp duties handled by the Zoudio board (https://zoudio.com/)
Here is quick view of specs (ignore the amp gains on crossover pic below)
How does it sound like..?
Here are two quick video clips shot on my mobile phone from close to MLP
Please be careful with volume
)I hope this at least gives a vague idea of the system performance.
In real-life listening, the system blows the socks and then some other things off even at low volumes (as in the video).
The system is just cruising and has incredible dynamics and clarity.
Just mindblowing
Well, I may need to take care of some room modes and a bit of fine tuning.. but that is work for another free day. As of now, I am really enjoying what I am hearing
Attachments
That's great. Wonderful job, as always.
Usually it helps to connect not only a capacitor, but also some voltage divider (resistors) in front of the driver. Otherwise, the capacitor interacts with the impedance of the driver in a way that strong peak(s) in the frequency response are created that need to be additionally dealt with in the DSP. With resistors, you are able to basically flatten the impedance first, eliminating this. Typically there's enough absolute sensitivity to start with. And if there's a need to decrease the sensitivity of the HF path, it's better to do this passively than in DSP.
Usually it helps to connect not only a capacitor, but also some voltage divider (resistors) in front of the driver. Otherwise, the capacitor interacts with the impedance of the driver in a way that strong peak(s) in the frequency response are created that need to be additionally dealt with in the DSP. With resistors, you are able to basically flatten the impedance first, eliminating this. Typically there's enough absolute sensitivity to start with. And if there's a need to decrease the sensitivity of the HF path, it's better to do this passively than in DSP.
I'm not sure about the order but lowering the crossover frequency would certainly help. It's pretty high as it's now - effectively just below 1k.
It could easily be 600 - 700 Hz. The waveguide alone has nothing but a very smoothly decreasing DI down to DC
But of course I understand this just as a quick experiment. I think Vineeth aims for a yet different design with this horn...
It could easily be 600 - 700 Hz. The waveguide alone has nothing but a very smoothly decreasing DI down to DC
But of course I understand this just as a quick experiment. I think Vineeth aims for a yet different design with this horn...
Last edited:
@tktran303
Yes. This twin woofer module has formed the foundation of all my initial 2 way and 3 way system configurations mentioned in the initial parts of this thread..
Yes. This twin woofer module has formed the foundation of all my initial 2 way and 3 way system configurations mentioned in the initial parts of this thread..
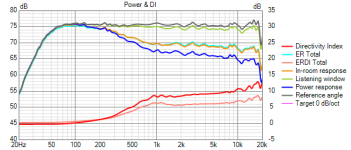
I am not as concerned about the abrupt change in DI from 200 - 1k. Visually it looks abrupt in the plot, but our eyes see the sharp corner at 900 Hz and it seems worse than it is. We don't listen to the DI curve, it is a calculated artifact... a very useful calculation, but still, that is all it is.
I have found that the best indicator of the tonal balance of a speaker in a "normal" room with "normal" reflectivity and absorption is the PIR curve. Vineeth, your PIR curve looks excellent to me. Some people prefer a uniformly sloping PIR curve with a slope of 0.8 - 1.0 dB/octave. However, I prefer one which slopes down by about 5 dB from 100 to 1k, and then is nearly flat above 1k, with a slight downward slope. Your PIR curve is just about exactly how I like it.
I have found that the best indicator of the tonal balance of a speaker in a "normal" room with "normal" reflectivity and absorption is the PIR curve. Vineeth, your PIR curve looks excellent to me. Some people prefer a uniformly sloping PIR curve with a slope of 0.8 - 1.0 dB/octave. However, I prefer one which slopes down by about 5 dB from 100 to 1k, and then is nearly flat above 1k, with a slight downward slope. Your PIR curve is just about exactly how I like it.
Even before considering an in-room response, everything should be fine with the source itself, IMO. For this the DI is very helpful as a simple inidicator of the overall quality, certainly not an artifact - it describes pretty well how the source radiates sound, which is what we do listen to. It's all tied together.We don't listen to the DI curve, it is a calculated artifact... a very useful calculation, but still, that is all it is.
(For DI to be a usefully robust indicator, it should be -in general- referenced to a listening window/the actual direct sound, but that's not really relevant here.)
Last edited:
- Home
- Loudspeakers
- Multi-Way
- A 3 way design study