the curves are fitted from Frank's electron tube pages
and inserted in a model.
http://www.mif.pg.gda.pl/homepages/frank/sheets/093/1/12B4A.pdf
Do you mean 8.6k plate to plate when 8 ohm in the
secondary?
However you can try this, if you want:
measure rms voltage at the primary ( plate to plate)
and at the secondary ( the load ).
I'll obtain the impedance value.
( a trafo has no impedance, really. It is
with reference to the impedance that loads the
secondary)
Federico
transformer
Federico,
I have some other stuff to do this morning so I can't measure. In the past I measured 155V peak to peak on one plate of the 12B4 giving 4Vrms across a 16 ohm load. I don't have a good way at the moment to measure RMS in the presence of DC without a ground on one side, ie no differential measurements.
The datasheet for the amplifier shows 8.4k (I misremembered 8.6k) with taps at 16,8 and 4 ohms on the secondary. So yes I would say it is 8.4k to 8 ohms. My quick calculation says it is more like 6k, but maybe I did it wrong.
Michael
Excuse me Michael,
It is no more necessary to make measure.
I forget that you have 3 taps 16,8,4.
so it is perfectly the same putting 8 ohm in the tap
marked 8 or 16 ohm in the tap marked 16.
The stage always see the same : 8.6k.
so, I obtain about 9k.
I'll start to simulate.
I go home now , I'll tell you tomorrow
Federico
Hi Tim,
The very strange thing ( if all happens as I suppose)
is that 3rd harmonic is cancelled by a signal generate
via IMD from fundamental and 2nd harmonic.
That is,for instance, 1kHz signal and its 2kHz distortion
feed the output tube, they generate a 3kHz signal by
intermodulation (f1+f2) and this signal cancel with intrinsic
3rd order harmonic generated by the fundamental.
Then the 2nd order signal is cancelled by the PP
topology.
Great.
I never read such a thing.
Federico
IMD
Hi,
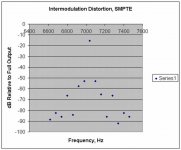
I measured, or tried, the SMPTE distortion method. The signal was one I downloaded and I am not sure if it is correct. I never looked at the output of the actual signal from the CD. Anyway the measurements were taken with 5.75Vrms measured at 60Hz and 1.35Vrms measured at 7kHz. Excuse the poor graph, I couldn't figure out how to get it to graph correctly.
If you have any questions, feel free to ask.
Micheal
Hi,
I measured, or tried, the SMPTE distortion method. The signal was one I downloaded and I am not sure if it is correct. I never looked at the output of the actual signal from the CD. Anyway the measurements were taken with 5.75Vrms measured at 60Hz and 1.35Vrms measured at 7kHz. Excuse the poor graph, I couldn't figure out how to get it to graph correctly.
If you have any questions, feel free to ask.
Micheal
Attachments
Hi
I made some simul.
155 V peak to peak at one plate become
4 Vrms at the load. This means 12k ohm
plate to plate( 6k seen by one tube).
Previously
22V rms at the grid become 8 rms at the load.
It mean 9.3k plate to plate.
But attention:
1) little measurement errors give large variation
2) in the second data the characteristics of the
tube are involved and I am not sure that your
tubes are equal to those in the sheets.
What means SMPTE ?
bye
Federico
re:smpte
Here are the specs of the test: The SMPTE (Society of Motion Picture and Television Engineers) standard specifies a two-sinewave test
signal consisting of a low-frequency, high-amplitude tone linearly combined with a high-frequency
sinewave at ¼ the amplitude of the low-frequency tone. The SMPTE specification calls for 60 Hz and 7
kHz as the two sinewaves. When a non-linear device is subjected to a two-tone test signal,
intermodulation products appear as sidebands around the high-frequency tone. The percentage
intermodulation distortion is defined as the percentage of amplitude modulation, represented by the
second and third order pair of sidebands, of the high-frequency signal. Second order sidebands around the
high frequency tone are spaced at a frequency equal to the low-frequency tone (FH ±=FL). Third order
sidebands are spaced at twice the low-frequency tone or FH ±=2FL. (FH and FL correspond to the highfrequency and low-frequency tones, respectively).
In the case of the graph shown above, which was collected at an output level just below the onset of major visible distortion of the 60Hz signal, as viewed on oscilloscope, I think the number would be 2%. Interesting that the 3rd and 6th products on the high frequency side are asymmetrical with the low frequency side. I remember double checking those datapoints and wondering why the difference.
Michael
Hi
Your results
at grid....................at output
22V.............................8V
.76V...........................2mV
60mV........................25.5mV
_________________________________
mine
22V.............................8V
.96V..........................(.1mV)
147mV........................19mV
in brackets non significative results
My sim distorting more then reality (at grid).
I suspect difference between your 6sn7
and my model.
However it does not matter.
with the utrapath 25 u cap I obtain:
22V.............................8V
.66V..........................(.2mV)
117mV.......................48mV
that is better at grid but worse
at output. This is important!
buon appetito
Federico
Cool
Hi Federico,
Most interesting. So it would seem that your hypothisis maybe finding support in the model. As I mentioned before, if there are any conditions you wish to have a measurement of or if you would like a repeat of any datasets I have given feel free to ask.
If I can ask, how closely do the results from equipment you have modeled and then built and measured usually match?
Michael
Thank You Michael
I have to say that measures and predictions do not agree well when speaking about distortion
figures. I easily found differences of 30% in 2nd harm and for the 3rd it is worse.
I think that if I can use the curves of the actual tube then things will be by far better. But I have not a curve tracer, thus I fit the model from standard datasheets ( e.g., Frank’s electron tube pages).
When, in post #50, I said my results very different from yours, I have made an error. Really, they are not so different (taking into account that your cir is not on my table).
It will be interesting if you can make measures with the ultrapath cap. to compare with my results of
Post #52.
I also try with a 15H choke at the cathode in series with 800 Ohm ( you’ll have to compensate to take count of the DC res of the choke). No anode choke ( so anode voltage increase a few owing to the absence of 2190 ohm.
In these condition the driver appear well balanced ( little 2nd harm) but the output is very distorted
22.1V.............................8.1V
.079V..........................(.24mV)
180mV.........................104mV
Federico
Conditions of test
Hi Federico,
Just to make sure I understand. In the circuit as I have been testing it with the 75H choke in the anode circuit, you want me to test a) 25uF cap from B+ to the top of the 6SN7 cathode resistor and b) no cap. For both of these conditions I should measure the H2 and H3 at the grid of the 12B4 at a grid swing of 22Vrms and at the secondary of the output transformer, where I should find a corresponding 8Vrms. Is that correct?
Also you would like to test a 15H choke in the cathode circuit of the 6SN7 in series with resistance to make a total of 800 ohms. What about the balance pot of 50 ohms that I have been using, leave it or take it out? No anode choke and no resistance to replace it. No extra anode capacitance. Take measurements at the grid of the 12B4 and the secondary of the OPT at 22.1Vrms and 8.1Vrms, respectively? Is that correct?
I have been worried with my past measurements that the input impedance of my wave analyzer maybe rather low and that it may be loading the grid circuit when I make measurements there. I do not have the manual for it. Could you suggest a method to test what the input impedance is? Alternatively, do you think I should use a 10Mohm oscilloscope probe as my test lead?
I have business this morning, but I should be able to make measurements this afternoon.
What fun,
Michael
Results 1
Hi,
I tested with and without a 25uF cap connected from between the 75H choke and the plate resistors of the 6SN7. Readings were taken at the grid of one of the 12B4 and across the secondary of the OPT. NO settings or input levels were changed between the tests. I noticed the output dropped by 0.04V when I connected the wave analyzer to the grid of the 12B4, probably indicating some loading of the circuit. DC conditions available if you desire them.
The results are:
With
22.8V..................8.1V
0.55V..................28.5mV
45mV..................118mV
Without
22.3V..................8.0V
0.81V..................3.2mV
63mV...................51mV
lAlthough not perfect agreement there seems to be concurrence with the model in that 3rd harmonic at the output rose with the cap while falling at the grid. Interesting.
Will try the other test in a bit.
Michael
Results 2
Federico,
I removed the 75H choke in the anode circuit. Placed a 15H (713 ohm DCR) choke in the cathode circuit of the 6SN7 and adjusted the DCR to 800 ohms. This resulted in a Vp for the 6SN7 of 183V vs 171V in the prior test. It resulted in a Vk of 6.1V vs 5.66V in the previous test.
The results are:
12B4 grid..................OPT sec
22.0V........................8.0V
12mV........................73mV
64mV........................200mV
Second harmonic numbers don't fit so well with your model. Third is definitely increased at the output while being mostly unchanged at the grid. I think the trend does fit the hypothesis though. Greatly decreased 2nd at the grid with resulting greatly increased 3rd at the output.
Exactly why there was a large increase in 2nd at the output has me confused though. Why would this happen since the 2nd should cancel in the OPT. Also, with the 15H choke in the cathode circuit the 50 ohm null pot has no effect on second harmonic at the output. It does fit with what I have seen before though, in the sense that I could find a circuit condition where 2nd could not be minimized to a low level at the output. Any ideas?
Later,
Michael
IMD with 15H cathode choke
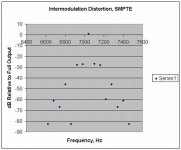
I measured the SMPTE IMD with the 15H cathode choke, all else remaining unchanged from the results directly above. It seems to have increased about 10dB. I did not look for this to happen. Notice that the graph is normalized to 0dB for the 7kHz signal, whereas the one further back was normalized to combined output.
Michael
Attachments
Re: Conditions of test
Wave analysers tend to be quite old pieces of equipment, and therefore part of the 600 Ohm culture. Fortunately, finding the input impedance is easy.
If unbalanced input: Connect an oscillator in series with a 50k variable resistor to the input and adjust the resistor to drop the level by 6dB. Disconnect the resistor and measure its resistance with a DVM - this is the analyser input impedance.
If balanced input: Connect a 20k 1% resistor in series with each leg and measure the attenuation, then use the potential divider equation to calculate the value of the shunt resistor (the input impedance).
Unfortunately for valves, audio test sets generally consider 50k to be a high input impedance.
audiobot said:I have been worried with my past measurements that the input impedance of my wave analyzer maybe rather low and that it may be loading the grid circuit when I make measurements there. I do not have the manual for it. Could you suggest a method to test what the input impedance is?
Wave analysers tend to be quite old pieces of equipment, and therefore part of the 600 Ohm culture. Fortunately, finding the input impedance is easy.
If unbalanced input: Connect an oscillator in series with a 50k variable resistor to the input and adjust the resistor to drop the level by 6dB. Disconnect the resistor and measure its resistance with a DVM - this is the analyser input impedance.
If balanced input: Connect a 20k 1% resistor in series with each leg and measure the attenuation, then use the potential divider equation to calculate the value of the shunt resistor (the input impedance).
Unfortunately for valves, audio test sets generally consider 50k to be a high input impedance.
- Status
- This old topic is closed. If you want to reopen this topic, contact a moderator using the "Report Post" button.
- Home
- Amplifiers
- Tubes / Valves
- 12B4A PP schematic