Best and Worst
It is the best and worst of worlds. I am building the amp for someone else, so I won't get to keep my baby. On the other hand I am spending somebody elses money, so damn the expense!! Kidding, somewhat at least. Both 2A3 and 300B are on my short list and I think the Lundahl 1620 can probably do right by an 845, 211 or triode connected 813. Most definitely want to go direct heated. I think the fellows speakers are not the most efficient and I am trying to talk him into an upgrade there as well. On the plus side, he says he doesn't play music very loud. Other tubes I should consider?
Michael
With Lundahls
Hi,
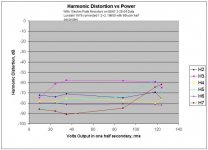
One more graph, now with the Lundahl transformers. Minimizing distortion now is a little bit different, a little bit the same. The optimum settings for the Rks and B+ depend very much on what maximum voltage swing I want to see. This is just one example. Still, seemingly not too bad?
Michael
Hi,
One more graph, now with the Lundahl transformers. Minimizing distortion now is a little bit different, a little bit the same. The optimum settings for the Rks and B+ depend very much on what maximum voltage swing I want to see. This is just one example. Still, seemingly not too bad?
Michael
Attachments
It can be simulated.
first, I have to find the 845 curves, maybe on frank's tube pages.
Then I had to digitalized them and to fit the model.
Once the tube model is ok I need the characteristics of the
output trafo, and a schematic with various data as B+, polarization, etc.
It can be done, Michael.
I start with the tubes.
Next week we can try to make all.
Federico
A little problem.
I have no success in finding data about grid
current of 845. This is important for class A2.
I'll continue searching.
Bye
Federico
P.S. I will refer to these curves (845 RCA)
http://www.mif.pg.gda.pl/homepages/frank/sheets/049/8/845.pdf
I have no success in finding data about grid
current of 845. This is important for class A2.
I'll continue searching.
Bye
Federico
P.S. I will refer to these curves (845 RCA)
http://www.mif.pg.gda.pl/homepages/frank/sheets/049/8/845.pdf
model
Federico,
I will await your successful model building for the 845.
I installed MicroCap. Would it be possible for you to send me the tube models and circuit you used for the 6SN7-12B4 parts?
I think you posted instructions for installing the tube files in another thread, can you tell me which one that was, I forgot, so I can reread them with the software installed?
Thanks,
Michael
Hi
the instructions are here
at post #22 and #26.
I have just finished 845 model.
This are the model curves to be compared with
datasheet of T110-1 pag.9-25 (plate) and 9-26 ( grid )
Grid curves are not perfect but good for simulation.
I am preparing a library for you with all the model.
When it is finished I'll send you it and the cir file.
bye
federico
Attachments
Hi Michael
here are the reference for
6sn7
http://www.audiomatica.com/tubes/6sn7.htm
and 12b4a
http://www.mif.pg.gda.pl/homepages/frank/sheets/093/1/12B4A.pdf
and here is the koren library with those tubes
note that for the above tubes the parameter KVB is
casual since it influences only the positive grid region
( and the grid current)
only for the 845 it has been fitted.
ciao
Federico
Attachments
Model
Federico,
I have the model installed and it runs. I can see a definite learning curve to being able to understand it, and a bigger one to be able to modify it.
Under AC analysis, what do the values X1, XV1 and GA represent? Is it saying the plate to plate load is 15.5kohms?
Yes, definite learning curve.
Thanks,
Michael
Hi Michael
Yes, X1 is the name of the upper output tube.
If you double click on it you’ll see some information
Among other, there is PART=X1 the name of that tube.
This name can be made visible on the schematic ( but it is not important).
The XV1 refer to the particular mode in which the model is made by me but it is not important.( model in the "text" page)
What follows is important: when you go under analysis/AC, for instance, if you
Click with the right button on the Y field a menu will pop up.
Put the pointer on /variables/ for instance, and then click on /device current/
Now you can choose the current of a specific component : a classic component
( resistor, cap. choke) or a component that you have in library or in the “text page” etc. in this last case the reference is to component elements.
GA refers to the Anode current GK for instance to the cathode, but these are names that I gave them, arbitrarely, in the library. It is common to use name starting with G for current
sources with E in case of voltage sources, R resistance C caps. Etc.
In that particular case, for the OPT tube , it plot the ratio between voltage and current, that is the load res of the tube. But it is multiplied by 2 to have the plate to plate resistance.
Yes, it is a little high but it was the only way to fit your data of gain, maybe your real tube and the model have different gain so I had to change the trafo ratio to have your voltage values.
Under transient analysis you can see a lot of things.
THD is in percent and is cumulative
( change it in IHD to see individual component %)
Harm/1.414 is Vrms
One can use also the db() function to have classic graph.
I will tell you the forum where I explained that one time.
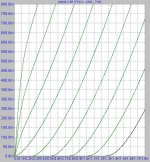
In the mid graph something simple.
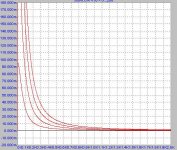
In the last the dynamic load line of one output tube.
I am not satisfied of the grid current model implemented and I am working on a new one.
Do not hesitate to ask me what you want.
You can utilize my email : fscarpa58@yahoo.it
Bye
Federico
Here is
try
this
and then post #62 up to #66
Yes, X1 is the name of the upper output tube.
If you double click on it you’ll see some information
Among other, there is PART=X1 the name of that tube.
This name can be made visible on the schematic ( but it is not important).
The XV1 refer to the particular mode in which the model is made by me but it is not important.( model in the "text" page)
What follows is important: when you go under analysis/AC, for instance, if you
Click with the right button on the Y field a menu will pop up.
Put the pointer on /variables/ for instance, and then click on /device current/
Now you can choose the current of a specific component : a classic component
( resistor, cap. choke) or a component that you have in library or in the “text page” etc. in this last case the reference is to component elements.
GA refers to the Anode current GK for instance to the cathode, but these are names that I gave them, arbitrarely, in the library. It is common to use name starting with G for current
sources with E in case of voltage sources, R resistance C caps. Etc.
In that particular case, for the OPT tube , it plot the ratio between voltage and current, that is the load res of the tube. But it is multiplied by 2 to have the plate to plate resistance.
Yes, it is a little high but it was the only way to fit your data of gain, maybe your real tube and the model have different gain so I had to change the trafo ratio to have your voltage values.
Under transient analysis you can see a lot of things.
THD is in percent and is cumulative
( change it in IHD to see individual component %)
Harm/1.414 is Vrms
One can use also the db() function to have classic graph.
I will tell you the forum where I explained that one time.
In the mid graph something simple.
In the last the dynamic load line of one output tube.
I am not satisfied of the grid current model implemented and I am working on a new one.
Do not hesitate to ask me what you want.
You can utilize my email : fscarpa58@yahoo.it
Bye
Federico
Here is
try
this
and then post #62 up to #66
- Status
- This old topic is closed. If you want to reopen this topic, contact a moderator using the "Report Post" button.
- Home
- Amplifiers
- Tubes / Valves
- 12B4A PP schematic