This does not reflect output impedance non-linearity. It is just OL output impedance divided by feedback factor, no level dependence shown.
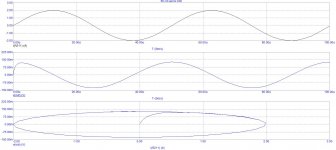
In case you are interested not only in nice plots, but also in something more useful, put the voltage generator not to the input, but to the output, via say 5 or 10 ohm resistor. Inject sine current of 1 - 10A into the output, measure current injected to the output and voltage at the output terminals of the tested amplifier. You can also make an X-Y plot of output voltage vs. injected current. Make this at several frequencies and then you will see output impedance nonlinearity.
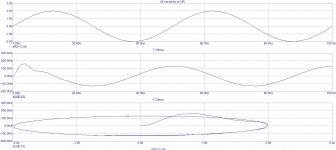
Hi Pavel, could you please comment this results, it`s with 2 Ohms load at 20KHz. What could you say of this amplifier by these results? Thanks.
This is the same conditions but with (worst case) 2uF parallel to the load, like in Dado`s schematic example.
Why there is distorted Vout signal only in the first periode and after that looks good?
Anyone else could comment, it`s not the question only for Pavel...
")
Thanks.
Attachments

Measuring the output Z by driving the amp from another amp leaves one question that is not obvious. Does the amps output Z and all its nonlinearities change with voltage? The measurements are with the output at 0 volts. If the output is at +1 volt you might see some different aspects. Also same signal into test and source amp with a phase shift to emulate the effects of a reactive load. Look at the signal across the resistor. This can really stress transistors as well.
The output inductance should be relatively constant since it is mainly determined by compensation. More so with beta enhanced or cascoded VAS.
The output resistance depends on whichever component causes the largest fluctuation in DC open loop gain. This may be the VAS transistor Early effect, output stage Early and Hfe fluctuations, and the bootstrap would play a role if your amp has one.
Output impedance, like distortion, is divided by open loop gain. At higher frequencies it is divided less due to there being less OLG, hence output impedance rises with frequency. The same applies to fluctuations in output impedance, which are divided less if they are fast. The result is the slow fluctuations are attenuated, leaving the fast ones, and you get a spiky looking load regulation waveform.
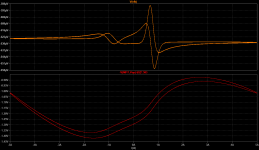
Here is the test done with one of my prototype amps in simulation. Top trace is the output voltage, bottom trace is the output stage error voltage (normalized). It uses lateral MOSFETs. Test is at 10KHz, 5Apeak.
You may think this looks bad. But you should consider that, if I were to lower OLG to smooth it out, I would not be reducing it - for this distortion would still be contained within the new resulting distortions. That is to say, it only covers them up by filling the oscilloscope screen with signal so that you must zoom out and then it looks tiny. But it certainly does not reduce them.
The output resistance depends on whichever component causes the largest fluctuation in DC open loop gain. This may be the VAS transistor Early effect, output stage Early and Hfe fluctuations, and the bootstrap would play a role if your amp has one.
Output impedance, like distortion, is divided by open loop gain. At higher frequencies it is divided less due to there being less OLG, hence output impedance rises with frequency. The same applies to fluctuations in output impedance, which are divided less if they are fast. The result is the slow fluctuations are attenuated, leaving the fast ones, and you get a spiky looking load regulation waveform.
Here is the test done with one of my prototype amps in simulation. Top trace is the output voltage, bottom trace is the output stage error voltage (normalized). It uses lateral MOSFETs. Test is at 10KHz, 5Apeak.
You may think this looks bad. But you should consider that, if I were to lower OLG to smooth it out, I would not be reducing it - for this distortion would still be contained within the new resulting distortions. That is to say, it only covers them up by filling the oscilloscope screen with signal so that you must zoom out and then it looks tiny. But it certainly does not reduce them.
Attachments
The output inductance should be relatively constant since it is mainly determined by compensation. More so with beta enhanced or cascoded VAS.<snip>
Can we hope to see a power amp from you?
//
It took me 10 years or so to to figure out everything I know about amps and learn the simulator, I think it is taking me another 10 years to approach the level of equipment and mechanical skill to design my prototypes. I designed a PCB and have the amp constructed, just need time and disposable income. So one potential way to see my work on or off the forum would be to hire me.
I don't want to keep my ideas off the forum, but making money is also not optional. I guess if someone can convince me that I will make more money by making my stuff public, then it's more of a possibility.
Top curve is the output voltage just like in Damir's test. Bottom is the voltage difference between the input and output of the output stage, but normalized so what you see is the deviation from an ideal resistor.
I don't want to keep my ideas off the forum, but making money is also not optional. I guess if someone can convince me that I will make more money by making my stuff public, then it's more of a possibility.
Very well reasoned and explained. Thanks.
I guess the top curve is the feedback error, bottom is Vout?
Jan
Top curve is the output voltage just like in Damir's test. Bottom is the voltage difference between the input and output of the output stage, but normalized so what you see is the deviation from an ideal resistor.
Take it from someone who made Audio their primary business (me). This isn't a scheme that will make money. A few do make a comfortable living at it, but it really only pays for itself with maybe some more left over for living expenses.
Mind you, that is better than many hobbies that are only a cash out deal. Not so bad in comparison.
-Chris
Mind you, that is better than many hobbies that are only a cash out deal. Not so bad in comparison.
-Chris
Scott,
As usual.
The other day at lunch I had a nice conversation with the top salesman for a major machinery company. He quickly grasped that while my competitors participate in bidding on construction projects I rarely do.
I have just under fifty years of experience and for folks who understand the value of that it adds to value. I like to make 5% net profit on a project.
I did just bid a job. I have to break it to the consultant that he specified much of the loudspeakers non-optimally. Then I think he is not going to believe me when I try to explain his choice of loudspeaker wire was designed for analog audio amplifiers and is quite unsuitable for the modern switching ones.
The issue is velocity of propagation and impedance. The current generation of switching amplifiers leak as much as 5 volts RMS at the clock frequency. This literally bounces back and forth on what at that frequency is a mis-terminated transmission line. I even have pictures!
The cable he specified is 65 strands of 28 gauge wire originally design for maximum surface area and no concern for twists per foot or velocity of propagation. When I designed it the concern was more for meeting electrical code and considering skin effect. Worse yet the main loudspeaker he chose also had my design input. It has advantages in reducing by about half the number of loudspeakers used to cover a venue. Not how he plans for them to be used.
Last edited:
I like to make 5% net profit on a project.
Ouch.. that's a tight margin...
Possibly the best way to make money from audio is selling small bits of quantum wood and quantum label dots for stupid money... Sadly.
Scott,
As usual.
What did I say this time?
The current generation of switching amplifiers leak as much as 5 volts RMS at the clock frequency.
.
I wonder what kind of "current geneation switching amplifiers" you are talking about.
A modern SOTA Class D amp?
Reodor
- Status
- Not open for further replies.
- Home
- Member Areas
- The Lounge
- John Curl's Blowtorch preamplifier part II