A software generated tone burst can take the stress out of some types of amplifier testing. An example is when checking loadline performance and operation in to pentode saturation region where continuous tone testing may stress valves and other circuitry.
I was just using REW software's tone burst function to generate 2 full sinewave cycles, along with a digital scope to capture output stage anode voltage and cathode current in a fixed-bias, class AB, pentode push-pull amp of nominal 100W rating. The ears also get it easy if a test speaker is being used instead of a power resistor.
A few different test conditions came to mind during testing.
The amp I had on the bench was a quad 6L6GC, and the 1.7kohm PP output transformer wasn't nicely aligned for such a quad (which would have preferred 2.5k PP from the datasheets for 400V screen and 450V B+). Testing with the output stage overdriven clearly showed max cathode current and min anode voltage to be hitting the pentode curve either over or under the knee when rated or 2x rated secondary loading was applied.
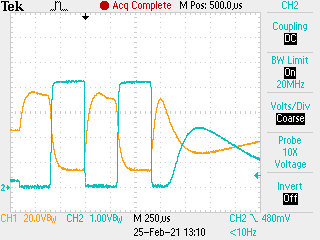
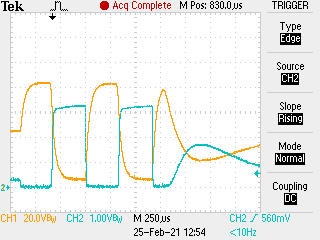
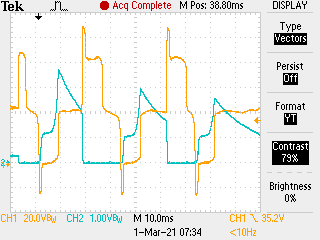
Plots below show orange trace as anode voltage (approx 200V/div), and blue trace is cathode current (100mA/div) for one 6L6GC. Idle condition on LHS of each plot is nearly 500Vdc and 25mA. 0V and 0mA is one division up from bottom. Left plot is for rated 1.7kohm PP of output transformer, and right plot is for 3.4kohm PP (16 and 32 ohm resistive loads on a 16 ohm speaker tap). 2 cycles of 1.5kHz with gross overload of output stage.
The saturation region performance of each valve in a quad can also be compared by noting the individual max cathode currents. The quad I had was vintage and certainly showed some variation in individual max current levels.
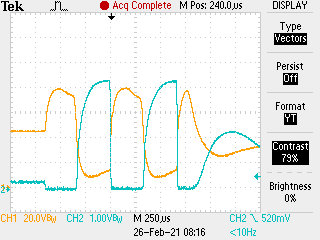
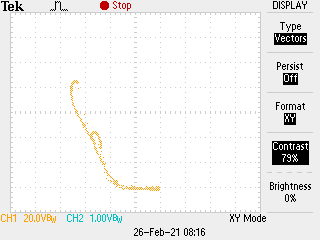
If your scope can present captured waveforms in XY mode, then theoretical loadlines become reality measurements. Plots below are for 1.7kohm PP loading (16 ohm speaker), and the speaker load alters the voltage and current waveforms a bit when the left plot is compared to resistive load plot above. In the XY plot presentation of the same data, the Y-axis is 100mA/div cathode current (blue trace in LHS plot), and X-axis is 200V/div plate voltage (orange trace in LHS plot) but origin (0V) is two divisions from left side.
Perhaps more for guitar amp applications, capturing grossly overloaded waveforms can be insightful, and a little less stressful than compared to turning up a volume pot and watching a scope waveform for a few seconds and then turning the volume down.
Now I need to think up some test situations where I can get one or both primary half-windings to exceed the normal voltage window limits from 0V to 2x B+, as I'd really like to test the use of MOVs for over-voltage protection across each half-winding of an output transformer.
Ciao, Tim
I was just using REW software's tone burst function to generate 2 full sinewave cycles, along with a digital scope to capture output stage anode voltage and cathode current in a fixed-bias, class AB, pentode push-pull amp of nominal 100W rating. The ears also get it easy if a test speaker is being used instead of a power resistor.
A few different test conditions came to mind during testing.
The amp I had on the bench was a quad 6L6GC, and the 1.7kohm PP output transformer wasn't nicely aligned for such a quad (which would have preferred 2.5k PP from the datasheets for 400V screen and 450V B+). Testing with the output stage overdriven clearly showed max cathode current and min anode voltage to be hitting the pentode curve either over or under the knee when rated or 2x rated secondary loading was applied.
Plots below show orange trace as anode voltage (approx 200V/div), and blue trace is cathode current (100mA/div) for one 6L6GC. Idle condition on LHS of each plot is nearly 500Vdc and 25mA. 0V and 0mA is one division up from bottom. Left plot is for rated 1.7kohm PP of output transformer, and right plot is for 3.4kohm PP (16 and 32 ohm resistive loads on a 16 ohm speaker tap). 2 cycles of 1.5kHz with gross overload of output stage.
The saturation region performance of each valve in a quad can also be compared by noting the individual max cathode currents. The quad I had was vintage and certainly showed some variation in individual max current levels.
If your scope can present captured waveforms in XY mode, then theoretical loadlines become reality measurements. Plots below are for 1.7kohm PP loading (16 ohm speaker), and the speaker load alters the voltage and current waveforms a bit when the left plot is compared to resistive load plot above. In the XY plot presentation of the same data, the Y-axis is 100mA/div cathode current (blue trace in LHS plot), and X-axis is 200V/div plate voltage (orange trace in LHS plot) but origin (0V) is two divisions from left side.
Perhaps more for guitar amp applications, capturing grossly overloaded waveforms can be insightful, and a little less stressful than compared to turning up a volume pot and watching a scope waveform for a few seconds and then turning the volume down.
Now I need to think up some test situations where I can get one or both primary half-windings to exceed the normal voltage window limits from 0V to 2x B+, as I'd really like to test the use of MOVs for over-voltage protection across each half-winding of an output transformer.
Ciao, Tim
Last edited:
Andy, yes it is open loop - a pre-determined input tone burst is applied to the amplifier, and the output response is measured (in the above case this is two internal parameters). The output stage does have a titch of local feedback from speaker tap to PI stage, which I have left connected for this initial testing, but could well influence certain behaviour.
The squiggle relates to the last part of the waveform response. Although the input signal stops after 2 full cycles, there is a damped overshoot occurring, which I'd say is mainly due to the energy in the primary inductance which doesn't want to equal zero as the last cycle finishes. That overshoot is shown in the orange waveform as the plate voltage flying above B+ then resonating down below B+ and in a damped manner rising back up to B+. The Plate voltage swing is happening in the same duration as the cathode current is rebounding (which I think is a driver driven effect) - so the XY plot has that showing as a small loop-de-loop squiggle when voltage and current waveforms are overlaid.
I will start doing some 'no load' testing soon, as one way to force the loadline to bang in to saturation region in the blink of an eye and build up some primary winding current before getting the other half of the push-pull to do the same. It's this open-circuit type of testing that I need to take some time with.
Last edited:
The example uses so far are not related to stability testing.
Although the input signal is a 2-cycle sinewave (because that is all that REW can provide in a burst mode), the signal input level and the amp volume and tone controls are maxed so as to present the output stage with effectively a large signal square wave voltage drive. The aim being to move each output stage pentode from cut-off to saturation with as high a slew rate as is inherently available, so that the saturation region performance can be observed in a short brief time window which won't stress the valves or other amp parts.
Although the input signal is a 2-cycle sinewave (because that is all that REW can provide in a burst mode), the signal input level and the amp volume and tone controls are maxed so as to present the output stage with effectively a large signal square wave voltage drive. The aim being to move each output stage pentode from cut-off to saturation with as high a slew rate as is inherently available, so that the saturation region performance can be observed in a short brief time window which won't stress the valves or other amp parts.
Thanks for the clarification Tim, if I've read your OP correctly your testing an OPT at what could be considered the extremes of operation, you also expanded on this in post #5, why is it important to test the saturation performance (and at a high slew rate), is this related to LF response? Lastly how could your test method apply in an amp design if not related to stability; valve matching?
Cheers, Andy.
Cheers, Andy.
Andy, I have been resurrecting a 100W Eminar guitar amp, with a forum thread over on AGGH. I typically add a MOV to each half-primary winding of the OPT, as a form of over-voltage protection, and one of the AGGH forum posts piqued my interest to use that amp, while it was on the bench, to do some stress testing and see if I could force the output stage plate voltage to fly beyond the 0V to 2x B+ voltage limits that are normally constrained by transformer action of the OPT. Given that I may need to use a speaker load rather than a resistor load, and push the output stage to extremes of operation, my first through was that my ears may complain, and if I was able to push the MOV protection in to action then 'continuous' stress may not be a good testing situation (for either the output stage valves, the OPT, the MOVs, or my ears).
At that time I realised that REW could easily generate signal bursts, so I started this test campaign by observing 'simple' overdrive conditions in the amp. I have seen a few other people presenting results of capturing output stage plate voltage and current waveforms, and presenting them as loadlines, but it is not a commonly made test, and quite rightly so as probing the plate voltage often goes beyond a scope probe's capabilities, especially for dc coupled capture. Although a curve tracer can nicely plot plate and screen curves for set parameter conditions, and a loadline can be drawn on datasheet plate curves, there is I think some value in seeing plate operation in an actual operating stage and especially when operating under limit conditions.
Post #1 was just about presenting some results for simple overdrive conditions, as they can be relatively easily related to operation on an anticipated loadline. At the moment I am just going through some 'no load' testing. Applying a high signal level to a valve amp with no speaker load is not a recommended activity, and although a loadline can be deduced for such a situation, I wanted to see if I could measure that as part of this test setup.
So no this is not about LF or HF response per se, although some aspects of what is observed needs an appreciation of LF or HF response. One aspect of vintage hifi that was reported on was how an amp recovered from gross overload (I think Heathkit presented some test results for one of their Williamson style amps to show it handled that situation), and even back then the concept of blocking distortion was starting to be discussed - both of those aspects relate to extreme signal operation and then recovery.
Last edited:
I was able to set up test conditions for a 'no load' situation which would cause PP output stage plate voltage to exceed the 0V to 2x B+ window. The test conditions did require near maximum amp volume and tone pot settings in order to force the plate over-voltage excursions, which aligns with various on-line comments I have come across over the years.
The plot below was with 2 cycles of a 30Hz waveform, although the preamp and driver stages would influence the grid voltage waveform shape presented to the output stage, so the drive waveform to the output stage grids would not be a lab-grade 2 cycle square-waveform.
The orange trace is the plate voltage (approx 200V/div) for one side of the PP output stage, where B+ was 500Vdc. The blue trace is the cathode current (100mA/div) for one of the 6L6GC on that side.
There is a MOV across each half-primary winding with a nominal 612Vdc min 1mA rating - those MOVs are likely just starting to load the over-voltage transients, but investigating that further is for another day/thread, as this thread was mainly about using a tone-burst as a tool to investigate stressful events.
Last edited:
- Status
- This old topic is closed. If you want to reopen this topic, contact a moderator using the "Report Post" button.
- Home
- Amplifiers
- Tubes / Valves
- Tone burst as a non-stressful test of maxed output