^Plan is not to force. Especially Angle step because for example 20 deg step prevents Reference angle of 10 deg at the moment. Requirement of 5 deg angle step to enable 5, 15 or 25 deg Reference angle could be small performance problem.
Some features are already frozen or refreshing of graphics delayed while optimizing. At least Directivity chart, Impulse response and Power dissipation are not calculated and chart/windows refreshed. Maybe XO link to Enclosure tool too.
Everything related to minimum phase could also be frozen while optimizing and refreshed when iterations are done.
One thing which was not mentioned in my list. Try to arrange real windows machine for this application, or at least mention if feature request or complain is based on performance on wine or some other low performance platform. Performance of optimizer is quite adequate imo.
Last edited:
The latest build of 2.0.27 optimized a bit.
When Optimizer is running:
+ Minimum phase not calculated + curve frozen
+ Excess phase not calculated + curve frozen
+ Normal group delay not calculated + curve frozen
+ Excess group delay not calculated + curve frozen
+ Room response not calculated + curve hidden
+ GD&Phase, Filter and Impedance charts refreshed when CPU is free enough
+ XO effect in Enclosure tool not updated
These were already done in previous versions:
- Directivity chart not calculated + curves frozen (though off-axis, power and DI are calculated)
- Impulse response not calculated + curves frozen
- Power dissipation not calculated + curves frozen
^No problem - takes max two minutes. That gives a bit smoother result with compression drivers. Side effect is that DI reference is 0 deg +/- X deg. Not for example 60 deg which could be valuable in some cases. So that calculation style cannot be the only choice. Two DI curves would serve both purposes.
--
I'll try to fix bad co-operation of library blocks and XO variants to the next revision. That is difficult because variant system was clued onto crossover schematic and block definitions are global for all XO variants. So at the moment we have to insert library blocks to all XO variants separately in order to separate attributes.
Rev. 2.0.28.0 (2019-10-25)
Main
* Added drivers text box to Optimizer for scaling target curve by number of drivers with the same polarity and crossover.
* Added drivers button to Optimizer for searching number of drivers with the same model name.
* Added buffers' total load impedance magnitude and phase curves to Impedance chart.
* Library block attributes saved to each crossover variant to improve tracking of attribute values.
Convert IR to FR
* Added DC offset checkbox to FFT analysis group. Average IR level before time window (max. 270 samples) is calculated and subtracted from all IR samples.
^DI calculation alternative is not done. Value is quite close to zero or even negative because hides diffraction problems.
Last edited:
Measurement programs could have at least optional compensation for DC offset. SoundEasy probably still have short period for d.c. voltage detection before actual measurement sequence.
Another option to fix LF magnitude is cropping exported txt/frd with frequency range minimum, and let response reader extrapolate down to internal limit. But that is not universal cure and cannot fix if amplitude error is still visible at 1/time_window_length Hz. Few...some users have selected this method to improve also phase response which suffers from window function. FR cropping + extrapolation + minimum phase extraction + timing bias would work to listening window, but not to 0-180 deg with all radiator types so that method cannot be selected.
Another option to fix LF magnitude is cropping exported txt/frd with frequency range minimum, and let response reader extrapolate down to internal limit. But that is not universal cure and cannot fix if amplitude error is still visible at 1/time_window_length Hz. Few...some users have selected this method to improve also phase response which suffers from window function. FR cropping + extrapolation + minimum phase extraction + timing bias would work to listening window, but not to 0-180 deg with all radiator types so that method cannot be selected.
^Driver's impedance does not match with Z parameter of the block. Those two should be equal to get textbook slope for ideal/flat load impedance. Scale impedance with Scaling factor in Drivers tab if you want to play with ideal default 8 ohms.
But this is just theory. Driver's load impedance is almost never ideal flat so this kind of textbook designing is not adequate in practice.
But this is just theory. Driver's load impedance is almost never ideal flat so this kind of textbook designing is not adequate in practice.
Bump at high pass
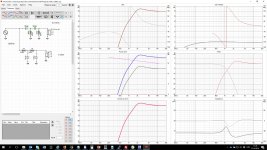
I've measured impedance for my drivers at crossover frequency 1200Hz. Bass has 8,3 Ohm and Tweeter 6,3 Ohm. My previous picture, show diagram made according to this values.
But with manipulation L and C I can get curve without bump.
So which one is correct? First one calculated by VituixCAD or second one where LC values are changed.
Another thing: why SPL doesn't show total SPL for both drivers.
Another thing: why SPL doesn't show total SPL for both drivers.
Click driver #2 on the xover, then select "driver #2" from the dropdown. Like it is for the other driver #1.
I've measured impedance for my drivers at crossover frequency 1200Hz...
That is not valid and recommended design method. Have you read section "Checklist for designing a loudspeaker", starting on page 4 in pdf user manual? Do you have possibilities to follow that, including final speaker or prototype ready for measurements, dual channel measurement gear with calibrated mic for acoustical and electrical measurements, etc?
If not, has anyone else time and interest to discuss proper design methods. Unfortunately I don't have enough time and resources to start from the basics.
Has anyone figured out how to change the db scale on graphs?
I have. Have you considered reading user manual?
")
Both of them are close, but neither is correct.So which one is correct?
The filter should follow the changing impedance. This can be easy or difficult. Sometimes you can change the values and sometimes you need a more complex network.
You can use a target curve and adjust your filter to try to copy the target.
^Yes, and final targets are usually acoustical responses so impedance responses and filter transfer functions (in electrical domain) are usually something else than ideal textbook curves. Therefore this kind of textbook design principles are just background knowledge without high value in practice.
Tweaking of rev 2.0.28.0 continues. Changelog after the latest mods:
Common
* Smoothing changed from average to Tukey 0.75.
* Added HF averaging within ppo to response reader.
Main
* Added drivers text box to Optimizer for scaling target curve by number of drivers with the same polarity and crossover.
* Added drivers button to Optimizer for searching number of drivers with the same model name.
* Added buffers' total load impedance magnitude and phase curves to Impedance chart.
* Library block attributes saved to each crossover variant to improve tracking of attribute values.
Convert IR to FR
* Added DC offset checkbox to FFT analysis group. Average IR level before time window (max. 270 samples) is calculated and subtracted from all IR samples.
Graph db scale
Yes, first thing I did. Perhaps it's there and I missed it.
I have. Have you considered reading user manual?
Yes, first thing I did. Perhaps it's there and I missed it.
This image was originally in ARTA thread. Now updated with the latest changes: averaging to 1/48 oct. frequency points where source response has much more data points per octave than internal frequency axis.
Weighted average of pressure values to each FR point improves the result if frequency response has much zigzag. Single internal FR point can include e.g. 900 pressure points by FFT at HF so some averaging is needed to prevent bigger errors.
Smoothing is still Tukey 0.75 though I could change it (in minutes) to any IR window option listed in Impulse response window. Now it hits between much smoothing REW and less smoothing ARTA and CLIO. This has not much significance, though might prevent excessive and irrational use of EQ.
An externally hosted image should be here but it was not working when we last tested it.
Weighted average of pressure values to each FR point improves the result if frequency response has much zigzag. Single internal FR point can include e.g. 900 pressure points by FFT at HF so some averaging is needed to prevent bigger errors.
Smoothing is still Tukey 0.75 though I could change it (in minutes) to any IR window option listed in Impulse response window. Now it hits between much smoothing REW and less smoothing ARTA and CLIO. This has not much significance, though might prevent excessive and irrational use of EQ.
- Home
- Design & Build
- Software Tools
- VituixCAD