It would be so nice to have check boxes to include radiation from adjacent wall, ceiling, floor surfaces.
Direct sound is already difficult and inaccurate because dual plane response data does not cover both rotation and tilting of driver while dual plane directivity simulation. Problem is self evident especially with rectangular drivers. Another issue would be processing speed.
Challenge with mirrored drivers would be acceptable with single response to reference angle, but directivity simulation in two planes should be switched off. Power & DI and Directivity charts would be blank.
Realized I had done the reflection incorrectly.
Found the "driver layout" window by right clicking in the schematic window (manual doesn't say) and corrected Z values of image drivers quickly and easily.
New results: front /listening axis only 3 db down. Boundary null disappeared due to curvature of baffle spreading out the reflection energy arrival times!!!! (more precisely - it moved well out of the passband - to 854 Hz)
Next need to evaluate side firing woofers...
Direct sound is already difficult and inaccurate because dual plane response data does not cover both rotation and tilting of driver while dual plane directivity simulation. Problem is self evident especially with rectangular drivers. Another issue would be processing speed.
Challenge with mirrored drivers would be acceptable with single response to reference angle, but directivity simulation in two planes should be switched off. Power & DI and Directivity charts would be blank.
Thanks.
I didn't see this until after my recent post.
I don't follow completely but I think I get the general idea. I already see slight but tolerable processing delay with the array. I understand accuracy issue at a high level. I know the image method itself has issues in the modal region.
But this is only way I see to get the answers I need short of building and testing prototypes. A qualitative answer is sufficient to my purposes - keep me from making expensive mistakes.
In this case, I only care about response out to 150 Hz or so where 5" driver is close to point source. Does that help with accuracy? When I look at the full range driver I really only want to see to what extent the curved baffle reduces boundary interference. What I see looking at the woofer is encouraging.
Hi Kimmosto:
I'm having a lot of fun/adventure taking this to the limit. I've got ~96 drivers between the woofer and full range arraays and their images and about a 4 second time lag after changing .e.g. a filter parameter.
Regardless of the accuracy, this design isn't complete without a front wall behind the woofer array to reflect sound forward or a ground plane image to complete the CBT.
I've managed to create a fairly smooth crossover between woofer array and full range but step response still indicates large time misalignment. What would you recommend as a process to find time alignment at this stage where I've imported single measurement on axis and relied on diffraction tool export to predict directivity for both drivers?
I've gotten the ball park first by an estimate based on physical offset and then refined by trying to match group delay for both sets of drivers but the GD is spread over a wide range for both sets of drivers, as one would expect from an array, and the frequency response at XO is not very sensitive to it one in the ballpark.
Thanks,
Jack
how to bring back the optimizer target line
Show target line should be checked in context menu.
Adjust by Shift + mouse drag to new position if target is outside visible Y scale.
")
Looking at the target line for the power response in a new project file, the slope is set at approximately 1 dB per octave. What made you choose this value as the default? Is this the generally accepted slope for balanced sound?
I'd be interested to get pointers / links providing some background / insight into this.
I'd be interested to get pointers / links providing some background / insight into this.
^No single truth out there. Balanced power slope depends on speaker concept and level of DI, decay and shape of room acoustics and listening distance i.e. how reflected power affects to sound balance at listening point.
In addition, quite short measurement distance and time window might have some effect to captured directivity: slope of simulated power can be steeper than measured power approximation at 2500 mm.
I have seen some recommendations for typical unidirectional boxed speakers. For example 5-6 dB within 200-12 kHz is mentioned as typical value in book 'Tee itse hifikaiuttimia' by Pekka Tuomela (2003). I suppose Toole has some numbers for DI in his documentation too.
Few examples close to 1.0 dB/oct:
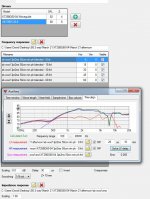
Larger radiators causing stronger directivity at high frequencies probably need steeped power slope to avoid tilting up of axial response. For example this is 3-way with 12" coaxial, far field measured at 1000 mm. Tilt of power is about 1.45 dB/oct.
In addition, quite short measurement distance and time window might have some effect to captured directivity: slope of simulated power can be steeper than measured power approximation at 2500 mm.
I have seen some recommendations for typical unidirectional boxed speakers. For example 5-6 dB within 200-12 kHz is mentioned as typical value in book 'Tee itse hifikaiuttimia' by Pekka Tuomela (2003). I suppose Toole has some numbers for DI in his documentation too.
Few examples close to 1.0 dB/oct:
An externally hosted image should be here but it was not working when we last tested it.
An externally hosted image should be here but it was not working when we last tested it.
Larger radiators causing stronger directivity at high frequencies probably need steeped power slope to avoid tilting up of axial response. For example this is 3-way with 12" coaxial, far field measured at 1000 mm. Tilt of power is about 1.45 dB/oct.
An externally hosted image should be here but it was not working when we last tested it.
I see there is now a legend. Great! How do I get this to show up?
Mentioned in changelog, rev. 2.0.13.5 (2019-02-28).
Mentioned in changelog, rev. 2.0.13.5 (2019-02-28).
Aha, so the legend only comes with the exported graphics? That's cool, but it would be even cooler if it would show up on the screen. I am just too stupid to remember all the curves; there are just too many! I have to look it up in the manual every few days... it could be done such that it does not show by default, but can be turned on via the context menu (right mouse button).
Aha, so the legend only comes with the exported graphics? That's cool, but it would be even cooler if it would show up on the screen. I am just too stupid to remember all the curves; there are just too many!
Tooltip over each curve shows the same description with legend.
I have also considered visible legend below chart area when chart is maximized (with double-click). Possible problem is that geometry of program window can be adjusted so that height is too short for legend: chart area fills available graph area and no room for legend.
Another option would be small pop-up window opening via context menu. Existing code is able to draw single column series list to any graph area.
..I suppose Toole has some numbers for DI in his documentation too.
A good talk on this subject:
YouTube
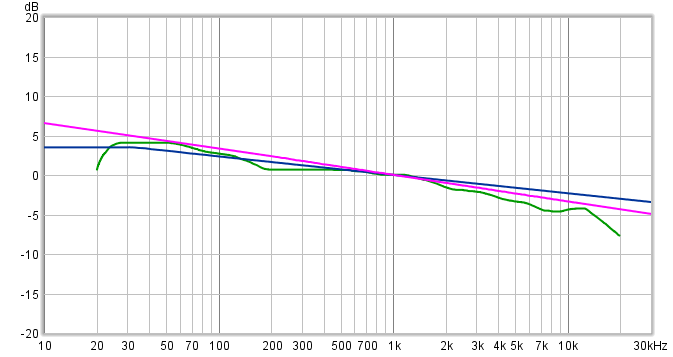
Shure target curves are interesting stuff, in below Toole's JBL study for the trained lister curve (green) is overlaid VituixCAD default (pink) and one called 7dB target curve (blue) used as default target in a APL Audio auto EQ tool (it falls exactly 7dB between points 30Hz and 30kHz). Guess they interesting references and also some relative close, that said in my ears its very sensitive stuff if one play around tilt them tiny 0,1dB at a time. Have hanged on those two target curves below should anyone be interested.
Attachments

Toole's JBL study for the trained lister curve (green) ... and one called 7dB target curve (blue)
Those are steady-state room response curves which is different than power response.
7 dB curve could be valuable with VituixCAD if power response is calculated to half space because slope is only 0.7 dB/oct.
Toole's curve is close to typical power response target. I suppose listening distance has been long and room damped or DI jumps at high frequencies. Looks also that Toole's test group has listened classical/acoustic music because very small signatures of conversion from large room and typical mic position to smaller room and shorter listening distance are visible.
Question about entering the Z offset in the driver setup,
When I use Jeff Bagbys PCD to check driver offset, my tweeter is 15mm behind my woofer (tweeter is in a waveguide).
Is that entered as a positive or negative?
When I use the Auxiliary offset solver, I get a woofer offset of 10mm.
Is that entered as shown?
Why the difference?
Measurements were made on tweeter axis at 50cm, sweeps were recorded with 3ms gating.
Thank you,
David.
Attachments
When I use Jeff Bagbys PCD to check driver offset, my tweeter is 15mm behind my woofer (tweeter is in a waveguide).
Is that entered as a positive or negative?
If woofer's delay is entered as 0 us, tweeter's delay is positive 43 us (15mm).
If tweeter's delay is entered as 0 us, woofer's delay is negative 43 us (-15mm). This is better way.
When I use the Auxiliary offset solver, I get a woofer offset of 10mm.
Is that entered as shown?
Why the difference?
Yes, but somehow the result does not look correct. LF delay should be negative if tweeter is behind. I will check calculation and sign later this evening. Could you send those three files by e-mail for testing?
- Home
- Design & Build
- Software Tools
- VituixCAD