... just developed a simple plot file generator (perl based) for LTSpice to be able to faster design the current limiter ...
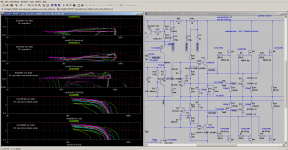
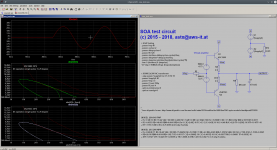
Attached a plot of relevant SOA lines generated from a definition file like:
In the example SOA is displayed for stepped 8 to 2R load using full power square wave and sinus wave.
Index:
2016.07.28 [post="4785853"] A perl helper to generate ltspice .plt files[/post]
2016.08.02 [post="4789774"] perl helper is now able to export linear plots too[/post]
2018.12.23 [post="5641782"] newest version including an example asc file[/post]
BR, Toni
Attached a plot of relevant SOA lines generated from a definition file like:
Code:
        my $traces      =       [
                {
                        'soa_of'                =>      'EXC10N20'              ,
                        'current_sensor'        =>      'Is(M1)'                ,
                        'diff_voltage'          =>      'V(+V,Vem)'             ,
                        'desc'                  =>      'DC SOA'                ,
                },
                {
                        'soa_of'                =>      'EXC10P20'              ,
                        'current_sensor'        =>      'Is(M2)'                ,
                        'diff_voltage'          =>      'V(Vnem,-V)'            ,
                        'desc'                  =>      'DC SOA'                ,
                },
                {
                        'soa_of'                =>      'KSA1381'               ,
                        'current_sensor'        =>      'Ie(Q7)'                ,
                        'diff_voltage'          =>      'V(VAS1,BIASH)'         ,
                        'desc'                  =>      'DC SOA'                ,
                },
                {
                        'soa_of'                =>      '2SC4793'               ,
                        'current_sensor'        =>      'Ie(Q11)'               ,
                        'diff_voltage'          =>      'V(+V,Vemdrv)'          ,
                        'desc'                  =>      'DC SOA'                ,
                },
                {
                        'soa_of'                =>      '2SA1837'               ,
                        'current_sensor'        =>      'Ie(Q17)'               ,
                        'diff_voltage'          =>      'V(-V,Vnemdrv)'         ,
                        'desc'                  =>      'DC SOA'                ,
                },
];Index:
2016.07.28 [post="4785853"] A perl helper to generate ltspice .plt files[/post]
2016.08.02 [post="4789774"] perl helper is now able to export linear plots too[/post]
2018.12.23 [post="5641782"] newest version including an example asc file[/post]
BR, Toni
Attachments
Last edited:
loading with resistance is realtively non stressfull.
Every amplifier should easily drive half it's rated resistance, i.e. all 8ohms amplifiers should drive 4r0 dummy load.
Very robust amplifiers should be able to drive 1/3rd of rated impedance when it is a resistance. Some might do even lower.
Attaching some reactance to the load changes the stress levels.
If the load is mildly reactive (at some frequencies), then that would be a 30degree phase angle for the load.
Moderately reactive is roughly accepted as 45degree phase angle for the load. Severe reactance is generally accepted as 60degree phase angle.
These reactive load lines transgress much higher into the available SOA. Even worse if the output stage, or the drivers have an elevated Tc requiring temperature de-rated SOA
Because the reactance tends to be worse over narrow bands of the bandwidth and because the current demand of a reactive load can be much worse for short period quickly changing transients, we can use the shorter period SOA.
100ms is typically suggested as a useful indicator.
I suspect that 10ms would be more appropriate for some analysis.
That means you need DC plus 100ms plus 10ms all plotted to see if any of the reactive load lines transgress which SOA and by how far.
Last edited:
In my understanding 45 degrees reactance is the peak stress for an amp, 90 degrees is actually less stressful. So testing with 60 degrees thinking you're testing worst-case would be a bad idea.
That is not what David Eather's paper shows.
Bensen's spreadsheet uses Eather's method and the plotted load lines go further up to the right and passed the SOA as phase angle increases from zero degrees all the way passed 60degrees.
I use that at 60degrees for all my analysis of load line vs (temperature de-rated) SOA .
Bensen's spreadsheet uses Eather's method and the plotted load lines go further up to the right and passed the SOA as phase angle increases from zero degrees all the way passed 60degrees.
I use that at 60degrees for all my analysis of load line vs (temperature de-rated) SOA .
AndrewT: thank you for background information regarding SOA.
If you want to discuss SOA in general it would be better to open a new thread. Do you want to discuss my perl based LTSpice soa plot generator we can continue here or in a new thread.
BTW: of course you can define 100ms and 10ms lines too if the SOA graph from datasheet has these data!
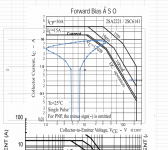
Here an example for two different soa lines on same plot:
BR, Toni
If you want to discuss SOA in general it would be better to open a new thread. Do you want to discuss my perl based LTSpice soa plot generator we can continue here or in a new thread.
BTW: of course you can define 100ms and 10ms lines too if the SOA graph from datasheet has these data!
Here an example for two different soa lines on same plot:
Code:
'KSA1381'       =>      {
        'soa'   =>      [
                # extents/lines of SOA table
                # from top left to bottom right
                # V-from        A-from  V-to    A-to
                '1      0.1     13      0.1',
                '13     0.1     200     0.004',
                '200    0.004   300     0.0024',
                '1      0.1     70      0.1',
                '70     0.1     300     0.012',
                '300    0.012   300     0.001',
        ],
        'desc'  =>      'DC operation uncooled/cooled',
},
Last edited:
I think we just have different methods. I started with a resistive load and added inductance or capacitance in series, which is realistic for a given voicecoil impedance. That way you get peak stress at 45 degrees. Your method seems to make more sense since speakers are specified by "nominal" impedance where the voicecoil impedance may be lower than that.
Wrong thread for this discussion though.
Wrong thread for this discussion though.
You are welcome to ask the Mods to extract this SOA stuff (or copy it) into a new SOA Thread.
I am not any good at LTspice. I have tried getting into it, but each time I return I have to go right back to the beginning to ensure I do every step as detailed in Cordell's guide. I just don't seem able to retain all the steps for the few simple things I have tried so far.
I am not any good at LTspice. I have tried getting into it, but each time I return I have to go right back to the beginning to ensure I do every step as detailed in Cordell's guide. I just don't seem able to retain all the steps for the few simple things I have tried so far.
You are welcome to ask the Mods to extract this SOA stuff (or copy it) into a new SOA Thread.
I am not any good at LTspice. I have tried getting into it, but each time I return I have to go right back to the beginning to ensure I do every step as detailed in Cordell's guide. I just don't seem able to retain all the steps for the few simple things I have tried so far.
Free Demo, SIMetrix/SIMPLIS analog circuit simulation software
Also possible is the quick but ugly excel superimposition method
Nice for all non ltspice users! Can you describe and upload an example excel sheet? BR, Toni
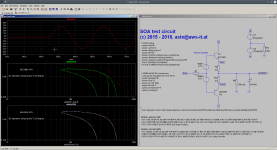
Software helper for LTSPice - SOA plot generator
A little example helper software written in pure perl to generate ".plt" files for LTSpice.
BR, Toni
A little example helper software written in pure perl to generate ".plt" files for LTSpice.
BR, Toni
Attachments
Last edited:
Software helper for LTSPice - SOA plot generator
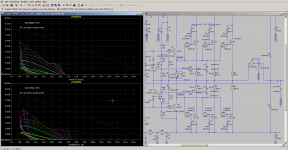
Newer version: can be used to export linear plots if enough soa data is available.
example usage:
(It would be nice if we could share SOA data ...)
If your simulation run is complete you can load your generated plot file.
On the command line you can generate newer variants of the same file on the fly, reload plot file in ltspice ... pretty cool and easy to analyze all your drivers, VAS, CCS and OPS transistors after ONE simulation run!
BR, Toni
Newer version: can be used to export linear plots if enough soa data is available.
example usage:
Code:
./generate_soa_plot.pl --input mytest1.input --linear > my_soa_plot.pltIf your simulation run is complete you can load your generated plot file.
On the command line you can generate newer variants of the same file on the fly, reload plot file in ltspice ... pretty cool and easy to analyze all your drivers, VAS, CCS and OPS transistors after ONE simulation run!
BR, Toni
Attachments
Last edited:
You are welcome!Toni, this is very nice! A good addition to our simulation arsenal - thanks!
Jan
For all non linux users: if you need perl you can download and install cygwin ...
BR, Toni
hi there can anyone tell me how to use it in LTspice?Newer version: can be used to export linear plots if enough soa data is available.
example usage:
(It would be nice if we could share SOA data ...)Code:./generate_soa_plot.pl --input mytest1.input --linear > my_soa_plot.plt
If your simulation run is complete you can load your generated plot file.
On the command line you can generate newer variants of the same file on the fly, reload plot file in ltspice ... pretty cool and easy to analyze all your drivers, VAS, CCS and OPS transistors after ONE simulation run!
BR, Toni
- Status
- Not open for further replies.
- Home
- Design & Build
- Software Tools
- Using LTSpice to check for SOA violations