I think there are a couple of aspects of this to consider. Where do you want to listen and in what kind of environment. The room where you have measured seems to have a lot of hard reflective surfaces. A narrower coverage pattern changes the balance of direct to reflected energy. Do you want to listen in one spot only, across a couch or in the whole room. The narrow coverage pattern will work better for a single position but as you move outside the coverage pattern the sound will change more.
There is an element of this in the DI of the speaker. If the DI is flat the sound will be very consistent over the whole coverage pattern, if the DI rises the sound will change more within the coverage pattern based on position.
If the DI is flat and the on axis is also flat, the speaker will sound bright with most existing recordings. If the DI rises and the on axis is flat the sound will be closer to "right" with existing recordings without needing EQ.
What is best and preferred will be a matter of balancing these competing priorities, there is no one universal right answer.
Great answer. And I believe this is what Linkwitz and Krevskovsky and were moving towards in the 21st C.
Getting out of the sound of monopole speakers in boxes, and into the room, or bringing the performance to you,
The "you are there" vs "they are here". feeling with dipoles.
Or do want to listen to the recording with surgical precision, under scope to do edits/mastering?
Which is entirely different from listening to the music for enjoyment and letting the sound just wash over you... Sean Olive commented on this at the end of Erin's Hardison's video review on Youtube... around 1hour 5 mins when a listener asked about wide dispersion vs narrow dispersion speakers....
I once measured the rear response of John Krevskovsky's NaO dipoles. And the rear response is a very close facsimile of the on-axis response, on 20Hz to 20KHz. I wish I had saved it. Maybe later this year I will attempt a quasi-spinorama on it and see how it looks, compared to a monopole
Last edited:
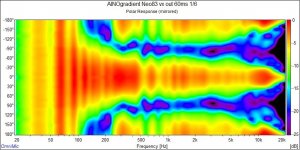
Here is my AINOgradient latest version horizontal directivity (mirrored). 100-200Hz is cardioid because bass is omnipole (downfire 10" woofer) Normalized version is my avatar! Measured with REW outdoors, spinorama with Omnimic.
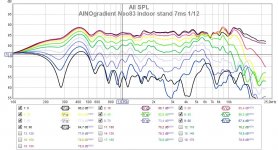
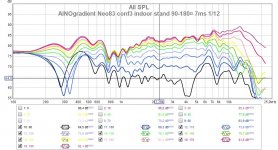
Difference in front/backside response with monopole tweeter and planar tweeter (indoor measurements) Backside response is low aroud 800Hz because of physical z-axis mismatch of low and mid drivers, match/delay is optimized to frontal. Sorry for different scale etc., I copied old graphs!
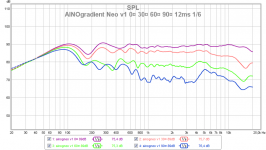
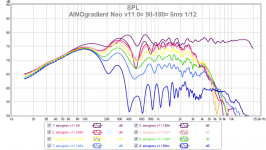
In this thread DonVK is experimenting a 3-way with modules that have different directivity, excellent study material!

Difference in front/backside response with monopole tweeter and planar tweeter (indoor measurements) Backside response is low aroud 800Hz because of physical z-axis mismatch of low and mid drivers, match/delay is optimized to frontal. Sorry for different scale etc., I copied old graphs!


In this thread DonVK is experimenting a 3-way with modules that have different directivity, excellent study material!
Last edited:
Thanks a lot JuhaziHere is my AINOgradient latest version horizontal directivity (mirrored). 100-200Hz is cardioid because bass is omnipole (downfire 10" woofer) Normalized version is my avatar! Measured with REW outdoors, spinorama with Omnimic.
View attachment 1046720
Difference in front/backside response with monopole tweeter and planar tweeter (indoor measurements) Backside response is low aroud 800Hz because of physical z-axis mismatch of low and mid drivers, match/delay is optimized to frontal. Sorry for different scale etc., I copied old graphs!
View attachment 1046722 View attachment 1046723
View attachment 1046726 View attachment 1046727
In this thread DonVK is experimenting a 3-way with modules that have different directivity, excellent study material!
I have been very eagerly following DonVKs thread
Questions regarding notch filter (in series with the driver) design
I have been trying to design a notch filter for the Satori WO24P-8 driver to tame its breakup peak and also possibly reduce the rise in harmonic distortion associated with it. This may probably matter only if the Satori driver ends up in a application where it needs to be crossed higher than usual. Something like low pass filter applied around 1 kHz or so.
The ideas/guidelines for the notch filter design is taken (to the extent I understood it, for now) from a similar application for the purifi driver as described here:
https://purifi-audio.com/wp-content/uploads/2022/03/220211_R05-Notchfilter.pdf
The reason for trying to use this filter for the the Satori driver is due to the following reason:
This driver has a big breakup peak around 3kHz as shown below:

If we take a look at the distortion plot of the driver as shown below, we can see a spike in 3rd order harmonic distortion (and second order harmonic distortion around 1kHz. This is a sub harmonic of the 3kHz frequency and I am assuming that the series notch filter reducing 3kHz breakup peaks will bring the distortion down).

I tried to compare between the following responses obtained by different notch configurations along with the lowpass filter for the driver and a little bit of passband linearization EQ.
Case-1)
No notch applied and corresponding filtered response and impedance plot (I have short circuited the filters and PEQ for the impedance plot)


Case-2: A notch filter (notch-1) applied:


We have about 10dB more attenuation of the breakup peak and a rise in impedance magnitude (40ohm vs 12ohm without notch) around the breakup peak. The hope is that this impedance rise will also reduce the distortion.
Case-3: Another notch filter (notch-2) and associated responses:


Please note the change in the frequency response around the 3kHz region and the 100ohm impedance magnitude around that frequency.
I understand that to see the effect of this whole thing properly, I should be taking/showing the distortion plots with application of each filter, but can we make useful conclusions/guidelines/observations without that for now?
Other questions regarding which implementation is better:
1) Should I aim for a plateau like suppression of the break up peak (notch-1) or the more rolling off type suppression with smaller peaks given by notch-2?
2) Also how do these impedances and their rise affect the amplifier's ability to drive the speaker, if at all there is any effect.?
3) Is there a guideline or some rule which says impedance variations we cause due to introduction of external elements as part of crossover/notch/frequency response shaping circuit shouldn't be higher (or should be lesser by some amount) compared to the the drivers impedance at its resonant frequency of around 25Hz?
Please let me know your suggestions/comments.
Thanks
Vineeth
I have been trying to design a notch filter for the Satori WO24P-8 driver to tame its breakup peak and also possibly reduce the rise in harmonic distortion associated with it. This may probably matter only if the Satori driver ends up in a application where it needs to be crossed higher than usual. Something like low pass filter applied around 1 kHz or so.
The ideas/guidelines for the notch filter design is taken (to the extent I understood it, for now) from a similar application for the purifi driver as described here:
https://purifi-audio.com/wp-content/uploads/2022/03/220211_R05-Notchfilter.pdf
The reason for trying to use this filter for the the Satori driver is due to the following reason:
This driver has a big breakup peak around 3kHz as shown below:
If we take a look at the distortion plot of the driver as shown below, we can see a spike in 3rd order harmonic distortion (and second order harmonic distortion around 1kHz. This is a sub harmonic of the 3kHz frequency and I am assuming that the series notch filter reducing 3kHz breakup peaks will bring the distortion down).
I tried to compare between the following responses obtained by different notch configurations along with the lowpass filter for the driver and a little bit of passband linearization EQ.
Case-1)
No notch applied and corresponding filtered response and impedance plot (I have short circuited the filters and PEQ for the impedance plot)
Case-2: A notch filter (notch-1) applied:
We have about 10dB more attenuation of the breakup peak and a rise in impedance magnitude (40ohm vs 12ohm without notch) around the breakup peak. The hope is that this impedance rise will also reduce the distortion.
Case-3: Another notch filter (notch-2) and associated responses:
Please note the change in the frequency response around the 3kHz region and the 100ohm impedance magnitude around that frequency.
I understand that to see the effect of this whole thing properly, I should be taking/showing the distortion plots with application of each filter, but can we make useful conclusions/guidelines/observations without that for now?
Other questions regarding which implementation is better:
1) Should I aim for a plateau like suppression of the break up peak (notch-1) or the more rolling off type suppression with smaller peaks given by notch-2?
2) Also how do these impedances and their rise affect the amplifier's ability to drive the speaker, if at all there is any effect.?
3) Is there a guideline or some rule which says impedance variations we cause due to introduction of external elements as part of crossover/notch/frequency response shaping circuit shouldn't be higher (or should be lesser by some amount) compared to the the drivers impedance at its resonant frequency of around 25Hz?
Please let me know your suggestions/comments.
Thanks
Vineeth
1) the speaker shows more of a shelving up response at 3k so this is not possible to kill completely with the notch.Questions regarding notch filter (in series with the driver) design
I have been trying to design a notch filter for the Satori WO24P-8 driver to tame its breakup peak and also possibly reduce the rise in harmonic distortion associated with it. This may probably matter only if the Satori driver ends up in a application where it needs to be crossed higher than usual. Something like low pass filter applied around 1 kHz or so.
The ideas/guidelines for the notch filter design is taken (to the extent I understood it, for now) from a similar application for the purifi driver as described here:
https://purifi-audio.com/wp-content/uploads/2022/03/220211_R05-Notchfilter.pdf
The reason for trying to use this filter for the the Satori driver is due to the following reason:
This driver has a big breakup peak around 3kHz as shown below:
View attachment 1047714
If we take a look at the distortion plot of the driver as shown below, we can see a spike in 3rd order harmonic distortion (and second order harmonic distortion around 1kHz. This is a sub harmonic of the 3kHz frequency and I am assuming that the series notch filter reducing 3kHz breakup peaks will bring the distortion down).
View attachment 1047713
I tried to compare between the following responses obtained by different notch configurations along with the lowpass filter for the driver and a little bit of passband linearization EQ.
Case-1)
No notch applied and corresponding filtered response and impedance plot (I have short circuited the filters and PEQ for the impedance plot)
View attachment 1047717 View attachment 1047720
View attachment 1047722
Case-2: A notch filter (notch-1) applied:
View attachment 1047723
View attachment 1047724
View attachment 1047725
We have about 10dB more attenuation of the breakup peak and a rise in impedance magnitude (40ohm vs 12ohm without notch) around the breakup peak. The hope is that this impedance rise will also reduce the distortion.
Case-3: Another notch filter (notch-2) and associated responses:
View attachment 1047727
View attachment 1047728
View attachment 1047731
Please note the change in the frequency response around the 3kHz region and the 100ohm impedance magnitude around that frequency.
I understand that to see the effect of this whole thing properly, I should be taking/showing the distortion plots with application of each filter, but can we make useful conclusions/guidelines/observations without that for now?
Other questions regarding which implementation is better:
1) Should I aim for a plateau like suppression of the break up peak (notch-1) or the more rolling off type suppression with smaller peaks given by notch-2?
2) Also how do these impedances and their rise affect the amplifier's ability to drive the speaker, if at all there is any effect.?
3) Is there a guideline or some rule which says impedance variations we cause due to introduction of external elements as part of crossover/notch/frequency response shaping circuit shouldn't be higher (or should be lesser by some amount) compared to the the drivers impedance at its resonant frequency of around 25Hz?
Please let me know your suggestions/comments.
Thanks
Vineeth
2) shouldn’t be a concern for a reasonable quality amp
3) no but adding series impedance changes the T/S parms of a driver. A resistor in series increases Qes. Interestingly, an inductor is effectively reducing the Mms (fs and Qes up). I plan to write another app not about this fairly overlooked effect. A series inductor simply has a side effect and this may lead to a wrong response if the designer is not very careful. Typical acoustic measurements are gated and hence has poor bass resolution so this effect is only visible in real anechoic measurements
Thanks a lot for these answers @lrisbo1) the speaker shows more of a shelving up response at 3k so this is not possible to kill completely with the notch.
2) shouldn’t be a concern for a reasonable quality amp
3) no but adding series impedance changes the T/S parms of a driver. A resistor in series increases Qes. Interestingly, an inductor is effectively reducing the Mms (fs and Qes up). I plan to write another app not about this fairly overlooked effect. A series inductor simply has a side effect and this may lead to a wrong response if the designer is not very careful. Typical acoustic measurements are gated and hence has poor bass resolution so this effect is only visible in real anechoic measurements
Regarding change in 'series impedance changing the T/S parms of a driver' part, would a T/S parameter measurement of the driver along with the series notch using a device like Dayton DATS v3 or similar capture the variations?
Or would a nearfield measurement of the driver (along with the series notch) with baffle step adjustment capture the new bass response of the driver (changed response due to addition of series impedance).
In any case, I will wait for your article to learn more about these aspects..
yes that is a nice feature in VCAD. Then add an estimated diffraction/baffle step and the complete bass response can be modelled (the filter is supposed to compensate the bafffle step)You can add the crossover parts for a driver into the enclosure modelling tool with this checkbox. That might help you see the effect of the series components.
View attachment 1047895
I tried to see the effect of crossover (including the notch filter) on the bass response of the driver. But seems like either something is wrong or if everything is right, there is only a minor impact in bass response due to the series impedance for this driver and alignment.
Here is the pic of the filters acting on the driver:

Plot below is the bass response I got with just the series notch (notch-1) filter.
Overlaid in blue dotted line is the response without the notch.

Below response takes into account the series notch and crossover filters:

Here is a comparative analysis of the bass response (given by vituixCAD) for the 3 configurations (driver in a closed box with 35L volume)
Leftmost pic: driver in box with no notch
middle pic: driver in box with only series notch
right pic: driver in box with series notch and crossover filters

Middle picture above shows some weird numbers for f3.
Comparing the leftmost and rightmost pics above shows minimal differences in f3 and f6.
Here is the pic of the filters acting on the driver:
Plot below is the bass response I got with just the series notch (notch-1) filter.
Overlaid in blue dotted line is the response without the notch.
Below response takes into account the series notch and crossover filters:
Here is a comparative analysis of the bass response (given by vituixCAD) for the 3 configurations (driver in a closed box with 35L volume)
Leftmost pic: driver in box with no notch
middle pic: driver in box with only series notch
right pic: driver in box with series notch and crossover filters
Middle picture above shows some weird numbers for f3.
Comparing the leftmost and rightmost pics above shows minimal differences in f3 and f6.
I tried to implement the series notch filter on WO24P-8 and see what difference it makes, just as a hands on experiment 
But, unfortunately, it failed in terms of capturing distortion measurements.
Anyway here is some data:
Implemented circuit (I got the inductor, capacitor, and resistor and added the analog series notch):

VituixCad predicted response:

Measured frequency responses and impedance using a MiniDSP Umik-1 at 30cm from the driver/Dayton DATS V3 (for different configurations of filters, notch)

Till here everything worked as expected.
Next is distortion measurements without notch but with other digital filters in above circuit activated:

Same distortion measurement as above with the series notch also in place:

Looks like the distortion measurements are buried in noise..
Anyway it doesn't look like the series notch does anything much good for this driver due to the shelf like breakup peak as Lars Risbo had pointed out earlier.
But now I know and have hands on experience doing this..
Maybe it will help in future...
But, unfortunately, it failed in terms of capturing distortion measurements.
Anyway here is some data:
Implemented circuit (I got the inductor, capacitor, and resistor and added the analog series notch):
VituixCad predicted response:
Measured frequency responses and impedance using a MiniDSP Umik-1 at 30cm from the driver/Dayton DATS V3 (for different configurations of filters, notch)
Till here everything worked as expected.
Next is distortion measurements without notch but with other digital filters in above circuit activated:
Same distortion measurement as above with the series notch also in place:
Looks like the distortion measurements are buried in noise..
Anyway it doesn't look like the series notch does anything much good for this driver due to the shelf like breakup peak as Lars Risbo had pointed out earlier.
But now I know and have hands on experience doing this..
Maybe it will help in future...
But how can we say non linear distortion has reduced in this case as H2 and H3 distortion measurements are below noise floor (brown curve) at most frequencies? Is it reliable?Doesn't do any good for linear distortion, but man that is a great improvement on non-linear distortion!
Do I need to take a measurement at 1m or more to see clearly what happens to distortion?
Well, if it's now below the noise floor and clearly wasn't before, I'd say that is a significant improvement!But how can we say non linear distortion has reduced in this case as H2 and H3 distortion measurements are below noise floor (brown curve) at most frequencies? Is it reliable?
Do I need to take a measurement at 1m or more to see clearly what happens to distortion?
In REW the noise floor is captured just before the measurement starts.
For better signal to noise try measuring closer, louder or at a quieter environment (at night, heating/cooling off.
Also change the scale to SPL or DBr, more informative if you’re doing fine surgery.

For better signal to noise try measuring closer, louder or at a quieter environment (at night, heating/cooling off.
Also change the scale to SPL or DBr, more informative if you’re doing fine surgery.
Seems to fit with what I experienced when notching the breakup on my old Accuton midrange. I run fully active, and can measure exactly where the driver broke up. By adding EQ to dampen the frequency where the driver started its breakup, then H2 and H3 lowered too. So say that I can't do this, as the breakup will always be there.... but distortion went down and I believe it sounded better - even though I know I'm biased, since I saw the response change on my measurements 
thanks for explaining the noise floor capture. the challenge is that noise may be non stationary, eg a car passed by when I did outdoor measurements yesterday. this showed up as a step up and down in harmonics between 100-200 Hz - this was a slow exponential sine chirp. I am actually working on a method that uses multiple mics to remove unwanted noise from the measurement (the Purifi HQ is next to a high way)In REW the noise floor is captured just before the measurement starts.
For better signal to noise try measuring closer, louder or at a quieter environment (at night, heating/cooling off.
Also change the scale to SPL or DBr, more informative if you’re doing fine surgery.

Thanks everyone for the comments so far about this notch filter exercise.. 
Today I tried to do stepped-sine waveform based distortion measurements.
Here are the results:
This time, I think the results can be trusted more compared to previous log sweep based measurements due to the lower noise floor than distortion in the area that we want to look at, i.e., around 1kHz to 4 kHz as the breakup peaks of the driver start around 3kHz
WO24P with no crossover and no notch:

WO24P with no crossover but with series notch:

There is some amount of reduction in distortion (both 2nd and 3rd harmonic distortion) at different places in the 1-4kHz region.
But there looks like slight increase in distortion (not much though) at some other places too..
Maybe I am trying the wrong notch filter for this driver. Maybe I should target the 1st breakup peak at the start of 3kHz instead of somewhere in the middle of that breakup shelf.
In the meanwhile speaker cabinet making is in progress but at a very slow rate at the moment.
Something to look forward in the real world


I wanted even bigger round overs everywhere but seems like I have to make do with relatively smaller round overs. Hopefully in an application where these bass boxes are crossed over around 300-350 Hz, round overs wouldn't matter as much as the cabinet's overall dimensions as we had seen initially in the simulations done by fluid..
Today I tried to do stepped-sine waveform based distortion measurements.
Here are the results:
This time, I think the results can be trusted more compared to previous log sweep based measurements due to the lower noise floor than distortion in the area that we want to look at, i.e., around 1kHz to 4 kHz as the breakup peaks of the driver start around 3kHz
WO24P with no crossover and no notch:
WO24P with no crossover but with series notch:
There is some amount of reduction in distortion (both 2nd and 3rd harmonic distortion) at different places in the 1-4kHz region.
But there looks like slight increase in distortion (not much though) at some other places too..
Maybe I am trying the wrong notch filter for this driver. Maybe I should target the 1st breakup peak at the start of 3kHz instead of somewhere in the middle of that breakup shelf.
In the meanwhile speaker cabinet making is in progress but at a very slow rate at the moment.
Something to look forward in the real world
I wanted even bigger round overs everywhere but seems like I have to make do with relatively smaller round overs. Hopefully in an application where these bass boxes are crossed over around 300-350 Hz, round overs wouldn't matter as much as the cabinet's overall dimensions as we had seen initially in the simulations done by fluid..
Last edited:
- Home
- Loudspeakers
- Multi-Way
- A 3 way design study