Hey xmo, thank you for this valuable input. Acoustical analysis would be a great addition indeed.
Here are the options installed :
- 1D1 : realtime octave measurements
- 1D2 : swept sine
- 1D4 : arbitrary source
- AY6 : 4 channels
- add 8 Mbytes memory
So it's lacking BASIC. The firmware is A.00.30 (it is from 2005)
The USB/GPIB cable is readily available on ebay. The one thing I'll be lacking is BASIC. I need to find out if Keysight still offers the upgrade, or if someone provides the upgrade.
Lacking Basic is no big deal. The reason why I got rid of the one I owned was no log frequency sweeps. Very annoying if you want to extend a frequency response over more than 2 decades in one pass.
With a frequency range of 10Hz to 50KHz and 1600lines (the maximum) the frequency bin is 30Hz, so the low frequency details are lost.
I must be missing what you are trying to say but the 35670A definitely does display data in log format when using swept sine mode. It also appears that the spacing of the acquired data points would be either linear or logarithmic, according to the display format.
See "Measuring Spectra and Networks" in the 35670A Operator's Guide:
"To measure frequency response—swept sine
1...
2...
3 Specify the measurement parameters
...
Press [RESOLUTN SETUP] [RESOLUTN] <number> <unit> to specify the number of measurement points.
Press [SWEEP LIN LOG] to highlight LIN if you want the measurement points to be linearly spaced, or to highlight LOG if you want them to be logarithmically spaced...."
Also, you can use the cursors to highlight the beginning and end of an area of a trace you want to view in greater detail:
"The scale markers are two lines that appear when you press [AXES SCAL MARKERS].
The axes scale markers let you enlarge a portion of the display for closer examination."
")
BTW: For USB or Ethernet to GPIB, the Prologix controllers are very hard to beat. You can find some scripts for them on my website: GPIB Control – Neurochrome
Tom
Tom
I must be missing what you are trying to say but the 35670A definitely does display data in log format when using swept sine mode. It also appears that the spacing of the acquired data points would be either linear or logarithmic, according to the display format.
See "Measuring Spectra and Networks" in the 35670A Operator's Guide:
"To measure frequency response—swept sine
1...
2...
3 Specify the measurement parameters
...
Press [RESOLUTN SETUP] [RESOLUTN] <number> <unit> to specify the number of measurement points.
Press [SWEEP LIN LOG] to highlight LIN if you want the measurement points to be linearly spaced, or to highlight LOG if you want them to be logarithmically spaced...."
Also, you can use the cursors to highlight the beginning and end of an area of a trace you want to view in greater detail:
"The scale markers are two lines that appear when you press [AXES SCAL MARKERS].
The axes scale markers let you enlarge a portion of the display for closer examination."
X axis (frequency) log format is not log frequency sweep. Get the frequency points from a linear sweep (equidistant in frequency) and put them on a log scale. You’ll get very sparse points at low frequency (poor resolution) and 90% of the points crowding at high frequencies where you don’t really need them all. A log sweep would keep the points equidistant in a log scale, so the resolution is the same at all frequencies.
Not many LF analyzer are doing log sweeps, but surprisingly the old 3562A does, up to an arbitrary number of decades within its frequency range.
Last edited:
Are you sure about that? My HP3562A does the same thing as the 35670A -- takes an FFT with linearly spaced frequencies and displays it on a log X axis -- sparse at LF and bunched at HF. It can't do anything BUT that due to the nature of the FFT. In swept (i.e., stepped) sine mode, it's a different manner.
Are you sure about that? My HP3562A does the same thing as the 35670A -- takes an FFT with linearly spaced frequencies and displays it on a log X axis -- sparse at LF and bunched at HF. It can't do anything BUT that due to the nature of the FFT. In swept (i.e., stepped) sine mode, it's a different manner.
Very sure. But it’s about the frequency response (or “swept sine”, if you prefer) frequency sweep, not about spectrum analysis. A simple power spectrum at a log frequency scale doesn’t make much sense. It does make sense (it is actually required) for noise measurements (in which each frequency bin power is divided by the bin size). Noise is best represented in a log-log scale.
Last edited:
Any FFT is like that, though. The bin width is fs/N, where fs is the sampling frequency and N is the FFT length. That's why you get poor frequency resolution at LF and excellent resolution at the HF end of a log-f plot with an FFT.
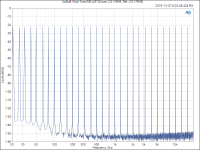
I've attached an example. In this case, the test signal is 32 tones of equal magnitude, logarithmically spaced in frequency. Note how the skirt around each tone is much wider in the LF end of the plot than the HF end, even though the width of the skirt around each tone is the same in terms of absolute numbers.
Tom
Attachments
From the operator's guide :
"Swept sine analysis lets you select linear or logarithmic spacing of the measurementpoints within the specified frequency span. Logarithmic spacing is a better choicewhen the span covers several decades. You can reduce the amount of time it takes tocomplete either a linear or logarithmic sweep by enabling the analyzer’sautoresolution feature. You can enable this feature by pressing [Freq][RESOLUTN SETUP], and then pressing [AUTO RES ON OFF] to highlight ON."
"Swept sine analysis lets you select linear or logarithmic spacing of the measurementpoints within the specified frequency span. Logarithmic spacing is a better choicewhen the span covers several decades. You can reduce the amount of time it takes tocomplete either a linear or logarithmic sweep by enabling the analyzer’sautoresolution feature. You can enable this feature by pressing [Freq][RESOLUTN SETUP], and then pressing [AUTO RES ON OFF] to highlight ON."
Any chance you have the full product or the location ?Hah! Lookie what I found. The old HP users group on Yahoo had a company guy who sold off their remaining copies of HP-Basic. The CD-ROM is unopened, and I can make an SD-RAM copy for anyone who cares (of course, you pay for the card and shipping.) It's for Windows95 or WinNT.
I don't have a 35670 anymore, only a 3577 (used fairly often for RF).
(Somewhere around here I have a program written for the 3577 which applied the RIAA curve by setting the amplitude at discrete frequencies).
Thanks //nick
From the operator's guide :
"Swept sine analysis lets you select linear or logarithmic spacing of the measurementpoints within the specified frequency span. Logarithmic spacing is a better choicewhen the span covers several decades. You can reduce the amount of time it takes tocomplete either a linear or logarithmic sweep by enabling the analyzer’sautoresolution feature. You can enable this feature by pressing [Freq][RESOLUTN SETUP], and then pressing [AUTO RES ON OFF] to highlight ON."
HiThe HP 35670A is a very solid piece of equipment. Before deciding on value for your application, you need to determine which options it has -- some would be desirable for audio and some wouldn't be that useful, though they wouldn't detract as you don't have to use them. I prefer my HP3562A but that's because I'm intimately familiar with it. For general audio frequency-domain work, either box would be OK.
I have 35670A fully optioned with Basic and was looking at getting a UK4 attachment but I was stuck for the LEMO connected 7 pin microphone and voltages 28/200V . Can anyone recommend a good microphone system I can use??
I am looking into extending this into ultrasound range analysis but need to start with basic 10-20k (16k) Hz is acceptable.
Help is appreciated . //Nick
Yes, I still have the entire pkg -- in the states.Any chance you have the full product or the location ?
Thanks //nick
Thanks, let me know how much it is for postage ( slow postage - cheap, I can wait )Yes, I still have the entire pkg -- in the states.
I am running a Win95 VM , I do have a copy of Rocky Mountain HTBasic for Win 10, I am interested to see What that variant of HPBasic will do.
I also have a 35670A with UK4 and Basic loaded, I was considering Buying a UK4 Hardware but got an attack of ignorance when it came to a type of Microphone connection LEMO plugs.
My address: 21 Lochard Dr. , Torquay Vic 3228 Australia.
I am on LinkedIn https://www.linkedin.com/in/dr-nick-sokolov-crd-aab69749/
Thank you for your help //Nick
Attachments
Yes, if you are measuring noise in a power supply, there's a lot happening between 1 and 100Hz -- of course the human ear doesn't hear a lot in that range, but for other applications (mechanical, medical etc) I can see how it would be important. Electrolytic capacitors have a noise phenomena below 15Hz, and one publication I read indicated that capacitor noise at 2Hz is correlated with probability of failure.X axis (frequency) log format is not log frequency sweep. Get the frequency points from a linear sweep (equidistant in frequency) and put them on a log scale. You’ll get very sparse points at low frequency (poor resolution) and 90% of the points crowding at high frequencies where you don’t really need them all. A log sweep would keep the points equidistant in a log scale, so the resolution is the same at all frequencies.
I have and use an HP 3565S system, which is a PC-based user-configurable system with performance equivalent to an optioned-out 35670A (16-bit converters). And I agree with most of what others here have written. Worth mentioning, though, is the wonderful preamps these instruments have. That more than anything is what keeps mine on the bench.
- Home
- Design & Build
- Equipment & Tools
- Agilent 35670a for audio analysis