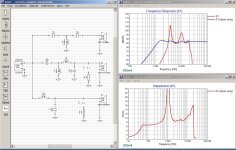
I've started learning Xsim crossover designer and thought I'd use the factory curves for the KEF drivers I have as a starting point - not ideal I know but I'm not able to measure speakers yet. The FRD and ZMA files seemed to turn out ok, as seen in the attached graph as Blue line S1 (driver only). But the results for the T27 tweeter when I drop the factory crossover in place as Red line S1, is a very sunken curve with 2 big peaks! In fact, this happens even when I replace the Concerto tweeter section with a 104aB section. It must be some very basic error I'm making so can anyone see what it is? The peaks start reducing if I add lots of resistance to the 2 caps, but never even out fully.
Attachments
It seems to match the factory curve, but not sure how 'truthful' the factory curve is. Ditto the frequency curve.
Impedance phase is included in the ZMA file (response phase is a different thing).. but you can force Xsim to reexamine impedance phase. I wouldn't though, because I believe the issue stems from the sudden drop above 20kHz. If you post the plot we can both try it and compare results..
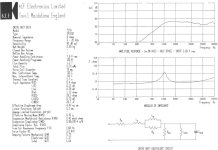
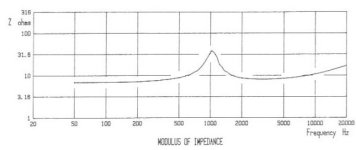
Sorry for the late reply but something came up. Here are the graphs I use to derive the FRD and ZMA files (the 2nd and 3rd ones are cleaned up a bit for the SPL tracer tool):
Attachments

Last edited:
I traced the impedance file and found a little improvement but it wasn't enough. Go into the driver properties in Xsim and choose "derived" for impedance phase. Then, with sensible 3rd order component values (bigger second capacitor, eg 6u8F, 750uH, 33uF) you should get rid of the peaks.
Attachments

This is what I found using your original zma file, with the test values I noted above and set for Xsim to re-derive phase.

My appologies AllenB, I forgot to tick the derived phase, and when I do, I get the same response as you. I wanted to start with a baseline of the factory crossover as in my original circuit, and I assumed it would look pretty flat, before trying to make any changes. But it looks like the files I'm using may be far from accurate. How good are factory graphs usually? And what are the disadvantages of the derived phase files?
Deriving phase for impedance should be accurate. For response, it is a potential problem so you shouldn't use it for response unless you know what you're doing.
For impedance, the main problem is the tails. Real curves go to infinity and we like to stop at 20kHz.. so there's some guessing going on. I used Vituixcad to make the trace, set to logarithmic Y-axis scale. I presume I did it correctly but I do make mistakes. The author has noted the expected limitations of curve tracing on the main thread.
For impedance, the main problem is the tails. Real curves go to infinity and we like to stop at 20kHz.. so there's some guessing going on. I used Vituixcad to make the trace, set to logarithmic Y-axis scale. I presume I did it correctly but I do make mistakes. The author has noted the expected limitations of curve tracing on the main thread.
Ok thanks, useful information. I use Vituixcad too as it seems to.trace lines more easily than the other program I've used (SPL copy?) I'll try to work my way through the mids and bass tomorrow and I'm sure the info I've been given here will be very helpful. Thanks again.
Lojzek, thanks, that looks pretty good. What is the source for your ZMA?
I have used "Drive unit equivalent circuit" of post #9 to create that file.
- Home
- Loudspeakers
- Multi-Way
- Xsim beginner problem