I am having a difficult time understanding why the influence of the top edge of the speaker contributes to a strong dip while the side edge doesn't.
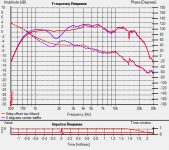
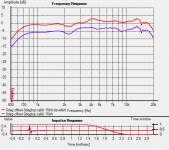
Attached is two measurements of a D2904_710001 on a cardboard baffle. On the initial measurements, the tweeter was 6.75 inches down from the top. Using a flat baffle 10 inches wide. The tweeter is 23 inches from the bottom. There was a dip at 1900Kz. (blue line) Initialy the speaker was centered on the baffle, I then moved it off center by an inch. No matter what I did, I could not significantly change the dip.
FYI I could not get 1/2" F10 felt to make a significant difference.
I eventually added 4 inches to the top pf the baffle,and noticed a large reduction in the dip. I then bent the top portion of the baffle back 30 degrees about an inch from the speaker flange and the resulting curve is what is seen on the graph. (red line)
Why does the top edge have such a dramatic effect? I would have thought that the side edges would have largest effect.
I also have a dip at 9kHz which relates to the diameter of the dome. Any known way to help that?
Attachments
The position (top/bottom/side) isn't really important. It's the distance from the driver that counts coupled with the driver directionality. This is why a circle is the worst case, every point on the edge is equidistant, so it concentrates the resultant time delays to a narrow range.I am having a difficult time understanding why the influence of the top edge of the speaker contributes to a strong dip while the side edge doesn't.
Attached is two measurements of a D2904_710001 on a cardboard baffle. On the initial measurements, the tweeter was 6.75 inches down from the top. Using a flat baffle 10 inches wide. The tweeter is 23 inches from the bottom. There was a dip at 1900Kz. (blue line) Initialy the speaker was centered on the baffle, I then moved it off center by an inch. No matter what I did, I could not significantly change the dip.
FYI I could not get 1/2" F10 felt to make a significant difference.
I eventually added 4 inches to the top pf the baffle,and noticed a large reduction in the dip. I then bent the top portion of the baffle back 30 degrees about an inch from the speaker flange and the resulting curve is what is seen on the graph. (red line)
Why does the top edge have such a dramatic effect? I would have thought that the side edges would have largest effect.
I also have a dip at 9kHz which relates to the diameter of the dome. Any known way to help that?
You may find some help in here:
"Understanding Cabinet Edge Diffraction" by Andy Unruh
Dave
Thanks,
Intersting read and useful.
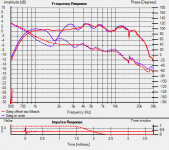
Attached is a graph showing the best response compared to adding felt triangle wedges. The wedges actually increased the resolultion of the diffraction interferance pattern in the frequency response graph.
I posted this graph only because it is interesting.
I am in the process of building a stiffer(heavier) baffle out of MDF to conduct more experiments. Cardboard seems to work, but being as flexible as it is I question its contribution to the measurements. I will also use my D2904/710003 in these tests as they have much less distortion. ( The d2904/710001 are horrible <2000Hz because I think I blew them in a previous speaker. They have an audible buzz down low ).
The focus of this study will be (within the limits of my existing cabinets) how to minimize the diffraction effect in the mid/upper driver region 300Hz to 25kHz.
Intersting read and useful.
Attached is a graph showing the best response compared to adding felt triangle wedges. The wedges actually increased the resolultion of the diffraction interferance pattern in the frequency response graph.
I posted this graph only because it is interesting.
I am in the process of building a stiffer(heavier) baffle out of MDF to conduct more experiments. Cardboard seems to work, but being as flexible as it is I question its contribution to the measurements. I will also use my D2904/710003 in these tests as they have much less distortion. ( The d2904/710001 are horrible <2000Hz because I think I blew them in a previous speaker. They have an audible buzz down low ).
The focus of this study will be (within the limits of my existing cabinets) how to minimize the diffraction effect in the mid/upper driver region 300Hz to 25kHz.
Attachments
Last edited:
I've got a couple of pages at my site with some examples of using felt. If you have back issues of audioXpress, you may be interested in the June 2005 issue. It has an article of mine that has a set of measurements of tests of various felt applications on a small M/T box with the midrange on an offset that shows just how well diffraction can be controlled.The focus of this study will be (within the limits of my existing cabinets) how to minimize the diffraction effect in the mid/upper driver region 300Hz to 25kHz.
The final felt pattern that I used is shown in the 3-way design example at my site.
Dave
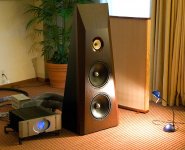
The 2K to 20K Hz tweeter frequency range has a 0.68" to 6.7" wavelength, so minor physical baffle shape changes can affect a wide frequency range. The attached photo of a dipole with a slanted top baffle shows one designer's attempt to control diffraction without losing the front sound field audio details from the tweeter and upper midrange.
Attachments
Thanks again Dave,
I just completed my test rig. I am going to repeat my initial measurements and then experiment with some of the stuff on your page.
With my test rig I can play with many different configurations simplyby making a new insert that allows flush mounting of the driver. It also allows for tilting the baffle and rotating the baffle to measure off center responses.
I'll see if I can get similar results to confirm yours.
Based on my inital measureents last night, the speak shown by LineSource makes sense. The top of the speaker is exactly what I did to eliminate the dip.
I like the AMP too
I like the AMP too
Considering that the system in the photo uses a wide range driver with no separate tweeter, I suspect that there was little diffraction other than step to consider. The tall section at the top could very likely have been made flat with almost the same response. The wide-range driver will, I suspect, be too directional for there to be much diffraction other than step.The 2K to 20K Hz tweeter frequency range has a 0.68" to 6.7" wavelength, so minor physical baffle shape changes can affect a wide frequency range. The attached photo of a dipole with a slanted top baffle shows one designer's attempt to control diffraction without losing the front sound field audio details from the tweeter and upper midrange.
Dave
I think I may have answered my initial question. With my original set-up, tilting back the cardboard stiffened the baffle. With my new rig I was unable to repeat the effect of tilting the top back and cancelling the dip. I also think that my original set-up resonated. The new one is filled with sand.
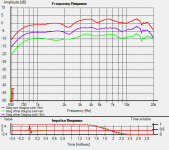
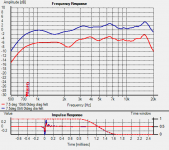
Out of the new stand comes some new questions. In graph 1 I compare a 15 degree tilted baffle, with a vertical baffle. With the speaker centered and offset. When the baffle is tilted a dip appears at 2200Hz (Which is exactly as my as-built speaker shows). Off centering the driver helps up higher >3500Hz but does not impact the 2200Hz dip.
The second graph shows the application of felt similar to dlr's site. In my case I am using F10 felt. There is a flattening at the higher frequencies above 6kHz, but I picked up a spike around 4100Hz. I need to go back and test but this may be related to the tilted baffle or felt spacing that is too close to the same.
Interesting Stuff.....I will post pics of the rig when I get my camera back.
Attachments
You could save yourself some time by using some of the available software that does a very good job of predicting the diffraction influence. Try "The Edge", "The Baffle Diffraction Simulator" (an Excel spreadsheet) or the latest version of Jeff Bagby's "Passive Crossover Designer" (another Excel spreadsheet). You'll be able to narrow the experiments that you conduct yourself. They're great time savers. You can investigate the off-axis, both vertically and horizontally.Out of the new stand comes some new questions. In graph 1 I compare a 15 degree tilted baffle, with a vertical baffle. With the speaker centered and offset. When the baffle is tilted a dip appears at 2200Hz (Which is exactly as my as-built speaker shows). Off centering the driver helps up higher >3500Hz but does not impact the 2200Hz dip.
The second graph shows the application of felt similar to dlr's site. In my case I am using F10 felt. There is a flattening at the higher frequencies above 6kHz, but I picked up a spike around 4100Hz. I need to go back and test but this may be related to the tilted baffle or felt spacing that is too close to the same.
Dave
I am a real novice but feel like a pro playing with some of that great software. IPlayed with Jeff Bagby's software and it is a nice tool.
Last edited:
Thanks for the heads up to Jeff Bagby's software. I had been using "The Edge" and was able to simulate a vertical baffle pretty well. With a tilted baffle I wasn't as confident in the result. Bagby's software makes more sense, at least to me. The results are a good correlation to what I measured.
Graph 1 D2904 offset with verticle baffle
Graph 2 D2904 offset with 15degree baffle tilt
Graph 3 D2904 offset with and without baffle tilt (actual measurements)
Graph 1 D2904 offset with verticle baffle
Graph 2 D2904 offset with 15degree baffle tilt
Graph 3 D2904 offset with and without baffle tilt (actual measurements)
Attachments
I would suggest you to measure the speakers again and compare the results at 0deg, 10deg, 20deg, 30deg, etc. This helps understand the baffle effects and gives you a more complete picture. You may be surprised at what you will find.
I should clarify baffle tilt is refering to tilting the baffle back. I will need to measure again to get more than 0 and 15 degrees. I did rotate the speaker (along vertical axis) 0, 7.5, 15, 30, 45 degrees and in the reverse direction for offcenter mounting. So I do have alot of curves to look at.
I am still studying them.....
Is there a good piece of software/freeware ideally that allows me to graph more than three curves at a time?
I am still studying them.....
Is there a good piece of software/freeware ideally that allows me to graph more than three curves at a time?
- Status
- Not open for further replies.
- Home
- Loudspeakers
- Multi-Way
- Why? Top Diffraction Dip Strongest