Bottom line, if you can place all the sources less than a quarter wavelength apart (at the highest frequency they are both on), they add coherently.
fntn,
I still think the LinkVan paper has strong relevance. I'm interested why you think its impractical. Have you read it?
Tom,
The definition of full incoherence in this scenario is the two curves 90 degrees apart. Any deviation from this results in a level of coherence (180 degrees is full negative coherence, mathematically). So, this makes sense.
I think the term "coherent" is causing some contention. True positive coherence is in-phase. True incoherency is n*90 deg apart. Anything in between results in partially full summation, partial coherence. How quickly this phase difference varies over frequency is dependent upon how far apart the drivers are in time, at the point of investigation. No real magic, it all falls out of standard xover simulation.
Tom, can you please point to the horn example? It would be an interesting read as these appear to have the lowest Tdiff.
The farther away the observation point is from disparate acoustic sources, the lower the time delay difference is between them. Perhaps that is what is being seen with the horns: the acoustic centers are farther from the listener than direct radiators on a baffle and so they have lower time delay difference at the listening position.
Dave
Nicely done article 🙂
While I've come across most of the information before it's nice to see it put together concisely with informative graphs.
However at risk of making a fool of myself I think you have a mistake, or at least an ambiguity in your Butterworth 3rd order results and graphs.
In the first Butterworth 3 "drivers in phase" graph you show that the notch occurs at 30 degrees, while the 3 dB hump occurs at -30 degrees.
However, you don't state at all (unless I missed it) whether this was calculated with the tweeter above or below the woofer, and this will obviously reverse the result, since the relative change in phase with vertical off axis movement will be opposite. With an even order filter it doesn't matter, but with an odd order it does.
Lets assume for the moment you meant for it to be with the tweeter above the woofer, the most common situation.
The next slight ambiguity is that you don't state explicitly whether positive degrees off the vertical axis (in your graphs) represents a listening point which is higher than the equi-distant design axis.
Again I would assume so as it makes sense to me to use positive angles for listening positions above the design axis, and negative values for listening distances below the design axis.
If we make both assumptions - positive off axis angles represent a higher listening position, and the tweeter is above, you seem to have your graphs back to front. A higher tweeter and a positive phasing between drivers should give the 3dB hump above the design axis, and the notch below the design axis.
Consider the relative phase shift of the drivers on the design axis for in phase connection - at the crossover frequency (-3dB point) the woofer has -135 degrees phase shift (lag) while the tweeter has +135 degrees phase shift. (lead)
Therefore the tweeter is +270 degrees ahead of the woofer, or another way of looking at it is -90 degrees behind. 90 degree relative phase shift summed together gives a gain of 3dB thus resulting in flat on axis response.
If we now move the listening position vertically up the distance to the woofer increases more than the the distance to the tweeter, thus more phase lag is added to the woofers response relative to the tweeter.
If we normalize the phase change between the two drivers (since only their relative phase matters in working out how they sum) then at some positive vertical angle (which also depends on distance) the Woofer lag will be -180 degrees, while the tweeter lead has increased to 180 degrees, total phase shift is now 360 degrees or 0 degrees, so there will be a 3dB hump.
Reversing the phase of one driver will swap the notch to be present in the positive angle range and the hump at negative angles. Reversing the physical position of the tweeter and woofer will also reverse the positions of the hump and notch, so both reversed drivers and reversed phase will bring us back to the first situation.
Am I wrong ? 🙂
I'm interested to know what you used to generate the graphs too, they look a bit like excel graphs ? Did you write your own custom formulas to generate them ?
You're right - I forgot to list some aspects of the model in the white paper, so let me list them here:
MODEL SYSTEM DESCRIPTION:
drivers are point sources in an infinite planar baffle
the tweeter is located above the mid/woofer
"on-axis" position is half way between mid/woofer and tweeter
off-axis angles > 0 are considered to be "above" the on-axis plane
Regarding your question about whether the off-axis responses in my plots are "back to front", I believe that what I have shown is correct. I re-checked the math by manually redoing a calculation of the relative distances from the drivers to the observation point and got the same result.drivers are point sources in an infinite planar baffle
the tweeter is located above the mid/woofer
"on-axis" position is half way between mid/woofer and tweeter
off-axis angles > 0 are considered to be "above" the on-axis plane
I did all of this in Excel, using formulas only, just as you suspected. I used Excel's complex number data type so that I can calculate everything in the frequency domain before calculating amplitude and phase at the end, as the magnitude (Excel's IMABS function) and phase angle (Excel's IMARGUMENT function). I like this approach, and I have used it several times in the past to work up acoustical models.
-Charlie
“I think we can agree that DDF's point about "true coincidence" has very little practical use.
What truly matters is the combination of the listening position and its angle relative to the acoustic centers of the drivers being used.”
Well, in the home market perhaps this is true now, but in commercial sound, resolving this has been a very useful tool .
Subjectively in the home, stereo is my life long hobby.
Consider what is required IF one were designing a speaker one of who’s goals is to provide the same frequency response and phase over a large listening area? I don’t mean the two hot seats at the couch but in a movie theater, music venue or Church? It is EXACTLY the things you mention like the interference between drivers that causes the lobes and nulls, things that cause one seat to measure much differently than another even when the room is excluded, it is a homogeneity in the pattern one is trying for, ultimately, to produce a portion of a simple expanding sphere.
Consider what is required if you were designing a speaker to be used in a large reverberant room? The primary object here is to confine the radiation pattern, to produce the highest “front to back” ratio so that the sound goes where the people are and as little as possible anywhere else.
A strong part of what governs a speakers polar or spherical radiation patterns is the interference between drivers that produces lobes and nulls instead of a simple pattern.
Make all the sources combine coherently into one source, there is no interference, no pattern of lobes and nulls, just a simple wide band width balloon.
If interested, you can down load a CLF (common loudspeaker format) data file for the SH-50. You also need the CLF viewer. These measurements taken by an independent lab.
You are exactly right about being a point source, to make these work, one MUST drive the horn with a point source.
The issue is “what is a point source in this case”.
If you use a horn, one finds that to avoid reflected sound or HOM’s, one must drive it as a point source, the source must be no large than about 1 / 4 wavelength across at the highest frequency in question for each range.
Now, an examination of “how large” that is physically , depends entirely on frequency, at 1000Hz, the wavelength requires that driver spacing must be less than about 3 1 /4 inches apart.
Once one is below that cutoff dimension, there is no change in the radiation angle as the source gets acoustically smaller as the horn is what defines the radiation angle.. In other words, two sources 1/100000 wave length apart behave the same within the horn as two sources 1/10 wavelength apart.
Examine the picture here about half way down, while thinking about the ¼ wave length requirement relative to the transitions / crossovers which on that speaker are about 300Hz and 1200Hz.
http://www.danleysoundlabs.com/pdf/danley_tapped.pdf
While the reproduction of a square wave over a broad band, over a wide angle “out front” may not be a requirement, it does illustrate that all the drivers course do combine into “one source” in time and space , only possible by resolving the very issue you discussed. I have not done the square wave test with all of the Synergy horns but most should replicate this, even the large ones like the JH-90 and SH-96 used in the Omni-max to Imax theater conversions.
Best,
Tom Danley
Danley Sound Labs
Bottom line, if you can place all the sources less than a quarter wavelength apart (at the highest frequency they are both on), they add coherently.
....
Earlier in this thread is an example of something that does a similar thing, a single full range driver on a large baffle,
With the growing number of very extended FR drivers it is very posible to build a 2-way with an XO at ~300 Hz or lower. This makes it pretty easy to get a speaker where the drivers are essentially coincident.
dave
The farther away the observation point is from disparate acoustic sources, the lower the time delay difference is between them. Perhaps that is what is being seen with the horns: the acoustic centers are farther from the listener than direct radiators on a baffle and so they have lower time delay difference at the listening position.
Dave
I thought the phase relationship was the determining factor, not actual time delay difference. Once a phase relationship between the drivers is established by the physical position, that relationship will not change with distance, unless one driver's sound travels at a different velocity. 😉
Horns are more likely to be about 1/2 or 1 wavelength behind the LF driver at xover, so that may be a more relevant explanation.
Ok, that's good to clear that up, it's what I thought, but I don't like to make an assumption.You're right - I forgot to list some aspects of the model in the white paper, so let me list them here:MODEL SYSTEM DESCRIPTION:
drivers are point sources in an infinite planar baffle
the tweeter is located above the mid/woofer
"on-axis" position is half way between mid/woofer and tweeter
off-axis angles > 0 are considered to be "above" the on-axis plane
Hmm, are you sure ? If so, can you spot a problem with my "back of an envelope" analysis of how the relative phase changes with position resulting in lobing ?Regarding your question about whether the off-axis responses in my plots are "back to front", I believe that what I have shown is correct. I re-checked the math by manually redoing a calculation of the relative distances from the drivers to the observation point and got the same result.
I have to say that I'm surprised, because I have a speaker that uses an 18dB/oct butterworth crossover between midrange and tweeter, (at 4Khz) with both acoustic centres aligned, and I specifically chose to have the drivers in phase so that the first cancellation axis was below the horizontal axis rather than above. (With tweeter above midrange) It's pretty clear from measurements (pink noise etc) that the nearest cancellation axis is indeed below the on axis position.
Unless I have an error in the order of 43mm in measuring the acoustic centres of the drivers (which would be 1/2 a wavelength) I can't see how it could be otherwise.
I did a quick google for references on the tilt direction of 3rd order filter lobes with polarity and driver placement, and didn't find that much, but did find the following, for what it's worth:
Filter & Crossover Types for Loudspeakers — Reviews and News from Audioholics
And also:3rd-order Butterworth: (Popular for some D'Appolito mid-tweeter-mid designs.) Produces a -3 dB crossover point to achieve a maximally flat amplitude response and flat power response that qualifies it as both an APC and CPC network. A 270 degree phase shift results in a + 15 degree tilt in the vertical coverage pattern if the tweeter is wired with normal polarity and a -15 degree tilt if the tweeter is wired with reverse polarity.
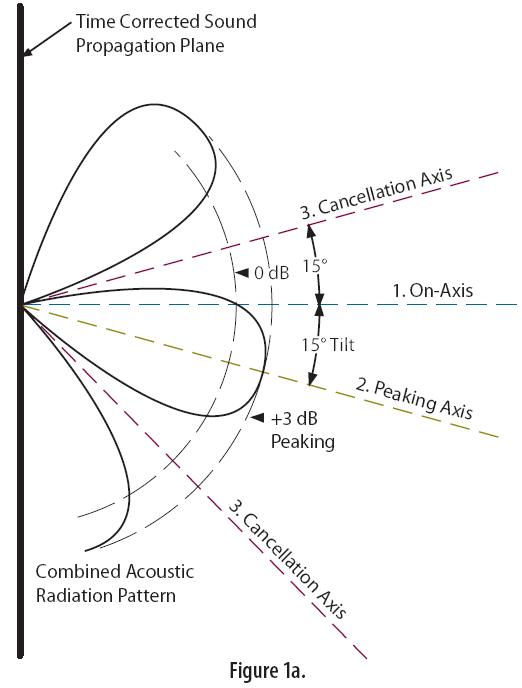
Linkwitz-Riley Crossovers: A Primer
What's not so clear in this second article is the phasing of the drivers in the shown graph (1a and 1b) is not explicitly stated, and the comment (highlighted by me in bold) is not as obvious as it might seem. In the 3rd order case the tweeter is 270 degrees ahead of the woofer (due to -135 lag of the woofer and +135 lead of the tweeter) however this is actually equivalent to a -90 degree lag thus because the phase wraps around the tweeter becomes the lagging driver, and the "peaking axis" tilts towards the tweeter.Figure 1a tells us that the magnitude of the emitted 1700 Hz tone will be 0 dB (a nominal reference point). As you lower your head, the tone increases in loudness until a 3 dB peak is reached at 15 degrees below parallel. Raising your head above the on-axis line causes a reduction in magnitude until 15 degrees is reached where there is a complete cancellation of the tone. There is another cancellation axis located 49 degrees below the on-axis. Figure 1b depicts the frequency response of the three axes for reference. For a constant voltage design, the response looks worse, having a 6 dB peaking axis located at -20 degrees and the cancellation axes at +10 and -56 degrees, respectively. The peaking axis tilts toward the lagging driver in both cases, due to phase shift between the two crossover outputs.
That's always been my understanding anyway.
Ah cool. I've never used the graphing functions of Excel (or Excel that much to be honest) until I recently used it to plot some graphs for a discussion in another thread, where I realised how easy and useful it is. I can see I'm going to have to teach myself more Excel, both formulas and graphing to be able to plot for myself thoughts such as the ones you put in your article... 🙂I did all of this in Excel, using formulas only, just as you suspected. I used Excel's complex number data type so that I can calculate everything in the frequency domain before calculating amplitude and phase at the end, as the magnitude (Excel's IMABS function) and phase angle (Excel's IMARGUMENT function). I like this approach, and I have used it several times in the past to work up acoustical models.
Ok, that's good to clear that up, it's what I thought, but I don't like to make an assumption.
Hmm, are you sure ? If so, can you spot a problem with my "back of an envelope" analysis of how the relative phase changes with position resulting in lobing ?
I have to say that I'm surprised, because I have a speaker that uses an 18dB/oct butterworth crossover between midrange and tweeter, (at 4Khz) with both acoustic centres aligned, and I specifically chose to have the drivers in phase so that the first cancellation axis was below the horizontal axis rather than above. (With tweeter above midrange) It's pretty clear from measurements (pink noise etc) that the nearest cancellation axis is indeed below the on axis position.
Unless I have an error in the order of 43mm in measuring the acoustic centres of the drivers (which would be 1/2 a wavelength) I can't see how it could be otherwise.
I did a quick google for references on the tilt direction of 3rd order filter lobes with polarity and driver placement, and didn't find that much, but did find the following, for what it's worth:
Filter & Crossover Types for Loudspeakers — Reviews and News from Audioholics
And also:
Linkwitz-Riley Crossovers: A Primer
What's not so clear in this second article is the phasing of the drivers in the shown graph (1a and 1b) is not explicitly stated, and the comment (highlighted by me in bold) is not as obvious as it might seem. In the 3rd order case the tweeter is 270 degrees ahead of the woofer (due to -135 lag of the woofer and +135 lead of the tweeter) however this is actually equivalent to a -90 degree lag thus because the phase wraps around the tweeter becomes the lagging driver, and the "peaking axis" tilts towards the tweeter.
That's always been my understanding anyway.
Ah cool. I've never used the graphing functions of Excel (or Excel that much to be honest) until I recently used it to plot some graphs for a discussion in another thread, where I realised how easy and useful it is. I can see I'm going to have to teach myself more Excel, both formulas and graphing to be able to plot for myself thoughts such as the ones you put in your article... 🙂
As indirect evidence that I am correct, I can point you to a similar analysis of the BUT3 crossover, done to analyze power response (of this crossover type and others), carried out by John Kreskovsky. You can find it at this link:
Power Response Analysis by John Kreskovsky
Near the bottom of the page, he shows the power response for several different types of crossovers, including for But3, which I have reproduced here:
An externally hosted image should be here but it was not working when we last tested it.
On this page of his series of power analysis web pages, he is using essentially the same analysis that I do - two co-planar point sources separated by some distance (his math is in the first half the page). While he doesn't explicitly state it (and that is why I didn't bring it up as a justification previously) the speaker is likely the normal tweeter above woofer arrangement.
So, how can this be compared with my result? The power response that he plots is just a "slice" through all off axis angles for a fixed frequency (he chooses the crossover frequency). My plots are frequency response for a select number of off axis angles that illustrate the off-axis behavior within some window of "on-axis". If you stay at the same frequency on my plots, each of the off-axis FR lines that cross that frequency represent a point on John's polar plot.
Once you think of it that way, you can see that the +3dB lobe is "above" the on axis and below is the null, both in John's way of plotting the data to highlight polar response and power, and my way that highlights frequency response.
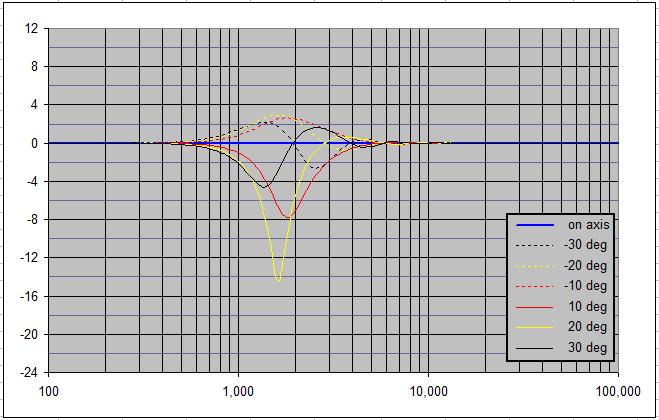
Also, I reproduced Figure 1a from the "Linkwitz-Riley Crossovers: A Primer" Rane document using my spreadsheet. This is shown below, with the Rane figure for comparison, for the same conditions:
1700Hz crossover point
Butterworth 3rd order
Both drivers connected with the same polarity
7 inches y-offset, z-offset = 0 (e.g. what Rane calls "Time Corrected" in the figure)


Again, the polar plot shown by Rane and the plots that I am generating are presenting the same data, just in different ways. If you look at the -10 degrees and -20 degrees response curves (dashed) at 1700 Hz on my plot, you can see that they peak at nearly +3dB. In the Rane polar plot, the 3dB "peaking axis" occurs at -15 degrees, so -10deg and -20deg are straddling the peak. Similarly, at positive 10 and 20 degrees in my plot, you see a partial null. These two angles straddle the "cancellation axis" in the Rane plot, at +15 degrees.
Again, since Rane didn't state which driver was "on top" this is only direct evidence, however I would assume they chose the normal "tweeter on top" setup.
Hope that helps.
-Charlie
Last edited:
Simple trigonometry says otherwise. The angle required to get a given physical time delay (thus phase shift) between two vertically offset drivers is different up close than it is far away - eventually stabilising on a minimum angle at far distances, depending on how far apart the drivers are.I thought the phase relationship was the determining factor, not actual time delay difference. Once a phase relationship between the drivers is established by the physical position, that relationship will not change with distance, unless one driver's sound travels at a different velocity. 😉
If you take the "virtual acoustic centre" of the two drivers as being the vertical half way point between the two drivers actual acoustic centres (at the crossover frequency) the angle of cancellation measured as an angle relative to that half way point changes with distance.
A worked example: (bear with me, as it's hard to describe without a diagram) Two drivers with a vertical offset of 20cm centre to centre. Two microphone listening distances, one of 0.5 metres, one of 5 metres. On axis the time delay between the two drivers is equal at both distances, obviously. You have two equal and opposite right angled triangles represented.
Now tilt the position of the microphone 15 degrees on the speakers vertical axis pivoting around the half way point between the two drivers acoustic centres, our "virtual acoustic centre".
Now work out the distance to each drivers acoustic centres from 0.5m and 5m from the "virtual acoustic centre" on the new 15 degree measurement axis.
We can work out the height and distance for the microphone for 5m from the virtual acoustic centre point with trig - the vertical offset is 129.4cm, while the horizontal distance from the line formed between the two driver acoustic centres becomes slightly shorter, at 482.96cm.
Now we know the exact position of the microphone we can work out the distances to each drivers acoustic centre.
For the top driver the distance is 497.50cm, and the angle is 13.89 degrees. For the bottom driver it is 502.68cm and the angle is 16.1 degrees. The top driver is nearer to the microphone than the bottom one by 5.18cm.
Now if we repeat the calculations for a nominal measurement distance of 0.5m. The vertical offset of the microphone is 12.94cm and the horizontal distance from the line between the acoustic centres is 48.296cm.
So from the microphone to the top driver we now have a distance of 49.999cm, and an angle of 3.48 degrees, and to the bottom driver we have a distance of 53.467cm and an angle of 25.41 degrees. The top driver is nearer to the microphone than the bottom one by 3.468cm.
What this means is the relative phase shift between the two drivers is significantly different at 15 degrees off the vertical axis measured at 0.5m than at 5m. As you get further away and the driver separation becomes smaller relative to the measurement distance the effect diminishes.
If you were to work it out the other way around - the necessary angle to get a certain phase shift, (to find the angle of cancellation for example) you'd find up close you require a steeper angle to get cancellation, but a shallower angle at further distances, with a steady angle by the time you reach infinity.
I have to say that I'm surprised, because I have a speaker that uses an 18dB/oct butterworth crossover between midrange and tweeter, (at 4Khz) with both acoustic centres aligned, and I specifically chose to have the drivers in phase so that the first cancellation axis was below the horizontal axis rather than above. (With tweeter above midrange) It's pretty clear from measurements (pink noise etc) that the nearest cancellation axis is indeed below the on axis position.
DBMandrake :
Are you aware that by having the drivers same polarity, the total phase shift is 360 deg, which IS NOT the same as being back at 0 deg. Is the position of the lobes more important to you than having the sound character associated with only 180 deg total phase shift?
This is not an admonishment, just an interested question. I prefer less phase shift configuration, and there is clearly a difference.
Last edited:
Ok you're confusing me here, because the data you've provided from this article actually agrees with me - provided that the likely assumption of tweeter above woofer is true, and provided that "up" in his polar plots represent the above axis measurement. (Can't see why it wouldn't) For the 3rd order filter the notch is clearly below the horizontal axis, and the 3dB peak is above.As indirect evidence that I am correct, I can point you to a similar analysis of the BUT3 crossover, done to analyze power response (of this crossover type and others), carried out by John Kreskovsky. You can find it at this link:
Power Response Analysis by John Kreskovsky
Near the bottom of the page, he shows the power response for several different types of crossovers, including for But3, which I have reproduced here:

On this page of his series of power analysis web pages, he is using essentially the same analysis that I do - two co-planar point sources separated by some distance (his math is in the first half the page). While he doesn't explicitly state it (and that is why I didn't bring it up as a justification previously) the speaker is likely the normal tweeter above woofer arrangement.
So, how can this be compared with my result? The power response that he plots is just a "slice" through all off axis angles for a fixed frequency (he chooses the crossover frequency). My plots are frequency response for a select number of off axis angles that illustrate the off-axis behavior within some window of "on-axis". If you stay at the same frequency on my plots, each of the off-axis FR lines that cross that frequency represent a point on John's polar plot.
Once you think of it that way, you can see that the +3dB lobe is "above" the on axis and below is the null, both in John's way of plotting the data to highlight polar response and power, and my way that highlights frequency response.
You'll notice that the 1st order crossover has it's lobe in the opposite direction from the 3rd order - because the relative phase shift of the two drivers is opposite to the 3rd order case. -45 degrees lag on the woofer, +45 degrees lead on the tweeter, means the tweeter is 90 degrees ahead of the woofer, and as the second reference of mine you reposted points out "the peaking axis tilts towards the lagging driver." (Because moving closer to the lagging driver and away from the leading driver moves closer towards the two being in phase with each other, leading to coherent addition and 3dB of gain)
The first article you reference also says "The flipping of the polar response for the Butterworth crossover [between orders] is normal and can be inverted by altering the polarity of one driver", which to me says that the polar responses were taken with in-phase driver connection.
As you say, in this reference they didn't state which driver was on top, nor did they state the phasing of the drivers. (Or even which way is up in the polar diagram)Also, I reproduced Figure 1a from the "Linkwitz-Riley Crossovers: A Primer" Rane document using my spreadsheet. This is shown below, with the Rane figure for comparison, for the same conditions:
1700Hz crossover point
Butterworth 3rd order
Both drivers connected with the same polarity
7 inches y-offset, z-offset = 0 (e.g. what Rane calls "Time Corrected" in the figure)
Again, the polar plot shown by Rane and the plots that I am generating are presenting the same data, just in different ways. If you look at the -10 degrees and -20 degrees response curves (dashed) at 1700 Hz on my plot, you can see that they peak at nearly +3dB. In the Rane polar plot, the 3dB "peaking axis" occurs at -15 degrees, so -10deg and -20deg are straddling the peak. Similarly, at positive 10 and 20 degrees in my plot, you see a partial null. These two angles straddle the "cancellation axis" in the Rane plot, at +15 degrees.
Again, since Rane didn't state which driver was "on top" this is only direct evidence, however I would assume they chose the normal "tweeter on top" setup.
It's somewhat common practice though, to connect a 3rd order butterworth filter with one driver out of phase - because the total phase shift is only 180 degrees vs 360 degrees of the in phase case. (Personally I don't do this, and prefer the in-phase connection for other reasons)
What they do say though, as I mentioned last time is "The peaking axis tilts toward the lagging driver in both cases, due to phase shift between the two crossover outputs.", and then leave it up to the reader to determine which is the lagging driver.
The 1st order butterworth case is nice and simple - the woofer is the lagging driver, lagging by 90 degrees, so the peaking axis tilts towards the woofers side. The first reference you provided clearly shows that the peaking axis swaps between 1st and 3rd order butterworths (the tweeter is 270 degrees ahead, eg 90 degrees behind) and so in this case the peaking axis tilts towards the tweeter.
I was slightly unsure of my position when I first posted but reading the various references and working it through in my head a few times has only made me more certain that I'm right. I'm still sure you have your vertical off axis angles reversed.
DBMandrake :
Are you aware that by having the drivers same polarity, the total phase shift is 360 deg, which IS NOT the same as being back at 0 deg. Is the position of the lobes more important to you than having the sound character associated with only 180 deg total phase shift?
This is not an admonishment, just an interested question. I prefer less phase shift configuration, and there is clearly a difference.
I am not sure why you state that 0 degrees and 360 degrees are not the same, because phase rotates around a circle of 360 degrees back to zero. It's only the difference that is important, and both of these (0,360) are at the same phase angle.
Can you give some more details behind why you bring up this point?
-Charlie
Yes I'm aware of the difference in total phase shift, and that out of phase connection of a 3rd order butterworth reduces total phase shift to 180 degrees, so from a strictly electronic filter perspective, the out of phase option is "better". (Gives less phase change anyway)DBMandrake :
Are you aware that by having the drivers same polarity, the total phase shift is 360 deg, which IS NOT the same as being back at 0 deg.
However for (primarily) lobing reasons I feel that in phase gives a better result, especially when the different directivity of the midrange driver and tweeter are taken into account, instead of assuming them both to be ideal point sources.
I'll give a little clue of what I'm getting at here - it's not only due to the vertical off axis response having it's primary notch in a less objectionable direction (downwards, below typical listening positions, and in a direction that doesn't contribute as much to the room power response due to furnishings) but also the horizontal off axis response at the crossover frequency.
With a real midrange driver which has increasing roll off off axis and increasing phase lag of it's own, whether you connect the drivers in phase or out of phase has an effect on how much the horizontal off axis response droops at the crossover frequency - far more for the out of phase connection.
Although you could get the same vertical lobing pattern by using a reverse phased 3rd order filter by putting the midrange above the tweeter, you won't get the same horizontal off axis response.
Careful choice of crossover frequency and driver spacing to match the off axis fall off of the midrange driver can considerably improve both the vertical and horizontal off axis sweet spot, but only the in-phase connection will improve it in the horizontal plane.
I haven't seen any evidence by any of the well known researchers in the field that absolute phase shift of this kind is in any way audible.Is the position of the lobes more important to you than having the sound character associated with only 180 deg total phase shift?
Whether a speaker has a total of 180 or 360 degrees phase shift across it's range doesn't seem to matter, provided that the phase change is smooth, and that the phase of the two drivers changes smoothly and in step with each other during the cross over region. Other than this, it doesn't seem to matter. (I'm not of the "perfect impulse response school")
I have seen on the other hand research articles that have shown the effects of an All Pass filter applied to a test signal to be inaudible - Linkwitz for example.
There is clearly a difference in different phase shifts for crossovers for example connecting a 3rd order filter in or out of phase clearly sounds different to me in an acoustically live room, however I very much doubt that it is due to the amount of absolute phase shift, but rather the effects of different lobing, effects on power response etc, due to non co-incident drivers that don't behave as ideal point sources.This is not an admonishment, just an interested question. I prefer less phase shift configuration, and there is clearly a difference.
If it was the phase shift alone inserting an All Pass filter into the signal chain which applies phase shift only should be audible - but many including Linkwitz have found it to be inaudible on any test signal or music.
YMMV 🙂
Last edited:
I am not sure why you state that 0 degrees and 360 degrees are not the same, because phase rotates around a circle of 360 degrees back to zero. It's only the difference that is important, and both of these (0,360) are at the same phase angle.
Can you give some more details behind why you bring up this point?
-Charlie
In order for phase to be back at zero, there would be a "kink" in the plot of group delay if the phase started back to 0 from 180 instead of continuing on to 360. There are articles in JAES and elsewhere that explore all of this, but as I stated, I do not have the specifics. I remember reading about this and was initially amazed, because I had previously assumed 360 same as 0. Not so, and the effect is audible, also discused in the white papers. And I also did the experiments, and for me is clearly a difference. J. R. Ashley did a lot of work on audibility of all the topics we have discused.
This concept was certainly not my original idea - I just study the data and try to figure out if it is valid.
It has been suggested that not everyone is "phase sensitive" and I believe this may be true based on my experience over the years. Many of my audiophile friends swear by audibility of phase funnies, while others can tell no difference.
Is total phase shift across the spectrum audible?
I found these references :
J. R. Ashley, JAES, vol 10, no 3, July 1962
J. R. Ashley, JAES, vol 19, no 1, Jan 1971
J. R. Ashley, JAES, vol 19, no 6, June 1971
Can't get any more reputable than this. This pioneering research seems to have gotten lost in all the new hype.
I doubt that humans have evolved so much in the last 40 years that this research would no longer be valid.
MMDV🙂 (My Mileage Does Vary)
Last edited:
I am not sure why you state that 0 degrees and 360 degrees are not the same, because phase rotates around a circle of 360 degrees back to zero. It's only the difference that is important, and both of these (0,360) are at the same phase angle.
Can you give some more details behind why you bring up this point?
-Charlie
Charlie :
I remember somewhere there was a graph of the phase changing around the circle, but it also moved along the z-axis such that 360 deg was above or below 0 deg. I believe it was in an article in Audio, maybe by Richard Heyser. Any articles you come across by him will be of great significance, since he brought the concept of the energy-time info to the attention of the audio community.
Wish I had kept better documentation, but all I was looking for was the answer.
AC
I like to think of a propagating signal using the visual of a corkscrew. The kind you open a bottle of wine with. If you look on end, all the "loops" of the screw overlap, and what you would see is like a circle. Now look from the side. The loops have the profile of a sort of up and down wiggling line.
A signal consisting of a single sinusoidal frequency propagating in space is actually very similar! The "time" axis runs along the center axis of the corkscrew, say from the handle to the tip. Looking from the side, you are seeing the amplitude of the signal. Looking along the axis, you are seeing the phase plane.
The illustration below shows the same idea:
An externally hosted image should be here but it was not working when we last tested it.
The phase plane is on the left. The amplitude on the right.
This is only showing a limited amount of propagation. The phase would continue to rotate and the amplitude continue to bob up and down continuously.
Here's another representation. This one is a continuous representation:

The phase plane is below. The amplitude above.
If I stare at it long enough, the upper part begins to look like a corkscrew to me...
Anyway, the phase on the phase plane is rotating continuously 0...-->...360/0...-->...360/0... etc. This is a much better representation of phase than an x-y graph, because the latter is just a projection and it can't represent a circle without a discontinuity. But the discontinuity is just an artifact of the x-y graph representation. There is no actual "jump".
-Charlie
Last edited:
I came across this interesting discussion about group delay:
Discussion of Group Delay in Loudspeakers
Discussion of Group Delay in Loudspeakers
Any more thoughts about the "kink" in the group delay? (From a previous post )
I couldn't quite understand what you meant by the "kink". Can you provide more info/background?
-Charlie
Plot group delay for the summed response of a 2-way 3rd order xover with same relative polarity. You will see it is a straight line with some amount of slope with no discontinuities. Now do same with one driver reverse polarity. Same result, just less slope.
If instead the phase reached a maximum at xover and then went back to zero, the group delay plot would change slope with increasing frequency past xover and no longer be a straight line - it would have a kink.
Now look at group delay of an EQ type of filter like in a graphic equalizer. There the phase DOES deviate and then go back to 0 deg.
Point of interest, there ae many audiophile purist who avoid Equalizers just because of this small amount of phase wiggle.
- Home
- Loudspeakers
- Multi-Way
- White Paper: Phase Issues and Crossover Considerations in Loudspeakers