Hi All. I just wanted to know what the graph I show here means. Can't understand it. Thanks. The X axis is showing mV?

Attachments
Last edited:
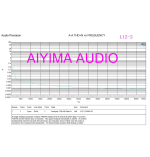
Um... The graph title says "THD+N vs Frequency" but the X axis is in volt. The Y axis is in percent as indicated by the "%" sign. So I'm thinking the graph shows THD+N in percent versus some voltage. Judging from the voltage range (low to 1 V) I'm guessing it's the generator amplitude, but your guess is as good as mine.
Tom
Tom
... wanted to know what the graph I show here ...
It shows that any graph without the measuring context is useless

Thanks for replying Tom, I have to say, I stupidly said the Y AXIS is in mV but I did mean the X axis. 🙄(cringe).... However, I feel justified in asking as it seems others are also slightly baffled NB: The small thumbnail graph has the same 2x axis and it is for the L12-2 amp the curve is then mostly flat. PS: I edited my question and corrected it now... Thanks for letting me know 🙂but the X axis is in volt. The Y axis is in percent as indicated by the "%" sign.
Last edited:
That I doubt. First off, because the axis is labeled in V RMS. Now, it could just be that the person who took the measurement enabled DC coupling on the AP input but didn't change the axis label. After all, they couldn't be bothered to change the graph title. But 1 V isn't usually enough to turn on a Class AB/B output stage and even if it did, the distortion would usually be very high at low bias where the amp is operating with severe crossover distortion, optimum at some bias level, and then maybe degrade slightly at higher bias.I suspect the horizontal axis could be a bias voltage for a class-B or AB amp.
This looks like a THD+N vs output power graph to me. In this case, that's measured as THD+N vs generator amplitude. Maybe the lab tech couldn't figure out how to get the AP to report the measured amplitude so the power could be calculated. That's a royal nightmare on the SYS-2700 software, which is likely what's used here.
It doesn't look like any sort of high performance amp and the sudden jumps in THD+N vs amplitude are concerning. I doubt that's caused by range switching on the AP, though that is a possibility.
Tom
As with all inquires like this I ask that the TEST FILE (*.ATx) be included. This tells me what all of the testing panels are set to, and it leads to a solution.
You can join LinkedIn, Classic AP Audio Systems Group LA, and post it and many real AP users could give you answers.
Duke.
You can join LinkedIn, Classic AP Audio Systems Group LA, and post it and many real AP users could give you answers.
Duke.
I was looking at the other graph.That I doubt. First off, because the axis is labeled in V RMS.
Many thanks for your answers so far. Presumably, whoever produced the graph, considers it displays how good the amplifier is? Maybe it does🙂 However the plot for the L12-2 is flat for the same test. More likely is that someone has picked up an erroneous file and just added it to the advert with no knowledge of what it means either 🙄
YESDo you know that if AUTO LABEL is OFF, you can enter your own TEXT.
Entirely possible.More likely is that someone has picked up an erroneous file and just added it to the advert with no knowledge of what it means either 🙄
Tom
- Home
- Amplifiers
- Solid State
- What does this graph Show Please?