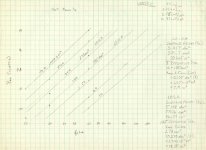
The following is the chart for how much air must be moved to produce which SPL @ 1Meter/1Watt. For most rooms, the 1Meter/1Watt figure will be reasonably uniform throughout the room.
These figures apply for under 100 Hz. You can extrapolate for above 100 Hz as well. However, below 100 Hz is where displacements become critical.
Remember, these numbers apply to Sealed Systems only!. A Bass Reflex system can produce up to 12 dB higher SPL for the volume displacements listed here.
Interestingly, these volume displacements will apply to the Drone Cone, (Passive Radiator) displacements as well. Not the driven speaker-the displacement of the Drone Cone itself.
This chart is taken from Richard Small, (of Thiele-Small fame), Analysis Of Closed Box Loudspeaker Systems
Part 1: Analysis
Published in the Journal Of The Audio Engineering Society in 1971, (I think it was 1971).
There are two charts. The first is in normal measurements, the second is in metric.
Enjoy. I think everyone will find these useful.
The whole chart fits on your screen if you press F11, assuming you use Windows.
And hats off to Richard Small for making such a useful chart, among so many other things! 🙂 🙂


PS:
Volume dispolacement is calculated by multiplying Cone Area, (Sd) times maximum excursion, (Xmax).
Please note that these charts are calculated using Xmax that is plus or minus. If your Xmax is listed as front-to-back, divide by 2 to use the values on this chart.
One way to calculate cone excursion is take the length of the voice coil, (VcL), subtract the height of the air gap, or gap length, and divide by 2. For instance, if your voice coil is 1" long and your gap height is 0.2", then your Xmax is .40".
Example: [ (1"-0.2")/2 ] = .40"
Practical Application
Hi Kelticwizard,
Nice primer. I thought I'd provide a practical application from my early experiences.
The graph below is a reproduction of Small's graph. Based on an article from Audio Mag., I set my goal to be able to produce 1 acoustic Watt (aW) (a bit ambitious, but doable). I had already purchased the JBL drivers, so my approach was backwards, but that's history. I had a JBL 124A, 12" woofer, and a LE10A, 10" mid-bass for each side. I extended the graph past 300Hz for the mid-bass. To the right are the results of my volume displacement calculations. I took those Vd values and created a line on the graph to represent the drivers maximum output capabilities. It shows that a single LE10A is max'ed out reproducing 1aW at just over 100Hz. the 124A was good down to about 65Hz.
Today I have 2 LE10A's per side, so their good to 75Hz. I have also replaced the 124A's with TAD 1601a's. These have a Vd of about 500cu.cm. In a stereo pair they max out at about 40Hz. As Kelticwizard indicated, these woofers get about 12db of help from the port.
Some qualifications next.
Rodd Yamas***a
Attachments
Some Considerations
Care should always be exercised when dealing on the theoretical level. There are typically assumptions made in the development of the theory being applied. You should be aware of these assumptions, and the ramifications if you do not know what the assumptions are.
One of these assumptions is that this graph is valid only in the bass region as Kelticwizard indicated. However, there are other reasons for this limitation then just the one that is indicated by Kelticwizard.
Small's graph has a second scale for SPL. But acoustic power and SPL are not a direct relationship. Outside of the bass region, you must take care in using this approximation.
Acoustic power is a measurement that is not dependent on directionality. The acoustic power generated by a speaker spreads throughout the listening area. In the bass region, this spread is omnidirectional. As the frequency being reproduced increases above about 100Hz (depending on the size or your room and placement of the speaker) the speaker starts to become diractional. It outputs the same amount of acoustic power, but that power becomes more focused. When this happens, the SPL associated with a given acoustic power level in the bass region, begans to increase while the output power stays the same. Once the driver is more then a quarter wavelength away from a room boundry, the relationship between acoustic power and SPL shown in Small's graph begins to change.
Roy Allison wrote a few papers on this subject. His speakers are designed to balance acoustic power and SPL in the listening room.
'Nough for now.
Rodd Yamas***a
well in reality one has to figure in room gain and fletcher munson curves to really see how much bass we need.
how do we do that?
regards
Navin
how do we do that?
regards
Navin
Navin:
Room gain? Please see my post in the following thread. It contains links to room gain charts. There is another chart that deals with higher frequency "baffle gain", an issue that you have raised more than once in the past.
http://www.diyaudio.com/forums/showthread.php?threadid=1261&highlight=room+AND+gain
Room gain will vary with each room, of course, but charts exist to give you an average idea. I spoke once with the tech department of Pyle Speakers and his chart showed 9 dB gain at 16 Hz-which is slightly higher than this chart. No matter-these are approximations anyhow.
Steve Ekblad's site cotains links to several freeware programs that deal with rooms. I haven't tried any, but Ekblad's links are ususally pretty good. Here is his URL:
http://www.wssh.net/~wattsup/audio/
Fletcher Munson curves? Well, the case could be made that if you were present at the original event that was recorded, the sound would be filtered through the Fletcher-Musnson curve as well. However, I do have an article that deals with thresholds and level from the Journal of The Audio Enginneering Society, I'll see if I can dig it up. The article is about what is required to make realistic goals for subwoofers.
I posted the chart because I like to keep things simple. It is now a reference that members can use to refer each other to, saving a lot of time explaining the same principles over and over.
I will be posting other charts that deal with basic concepts. I am not an engineer-I am just a hobbyist myself, and I found these charts useful in putting things into perspective.
point taken.
however i only wrote what i did so that we did not loose sight of the full picture.
what we hear is a combination of many factors. the room is one of them. Roy Allison (Allison Acoustics and before that he was in AR) used to make an argument about using the room to augment the bass response of a system.
Klipsch with their corner loaded horns did the same.
Bose takes "psychoacoustics" to a whole new level. 🙂 *EWG*
The full picture includes the room, our individual listening preferences, and the active components (speakers, electronics etc.).
My listening preferences are wide (baroque one day, heavy metal the next) hence I am trying to build my speakers so that they are equally flexible.
cheers.
Navin,
You're absolutely correct in that there are volumes of information on hundreds of important issues that should be considered when designing your speakers. This was my reason for trying to focus on the usefulness of this graph and the information it contains.
This is a primer level graph that helps to answer one of the first questions that arise when a newbie decides to make a pair of speakers.
How loud do I want my speakers to play?
How big do my speakers have to be to play that loud?
And there are other newbie (and not so newbie) questions that this graph helps to answer if you know the graphs limitations.
Does your Vd meet your needs?😉
Rodd Yamas***a
My Vd?
I use 4 12" from Audio Concpets. 2 per channel.
Assuming each speaker has a Sd or 330cm and a one way linear Xmax of 1cm we got 330cc per speaker. 330x4 = 1320cc.
I mostly listen to acoustic music. you figure it out 🙂
The way my system is configured is that the sub are off when I am listening to acousitc or soft music. my main speakers are MTMs using SS 8546 and 9900. Enough for most needs.
When (rarely nowadays) I need to rock the sub are used.
hope that answers your question.
Hi,
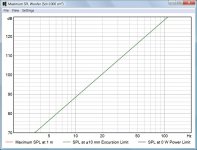
this is a very old thread, but the physics have not changed, and I still occasionally check this graph to refresh my memory, so I think it's appropriate to reply. Seeing as I noticed something today, a disparity of the maximum SPL that this graph indicates for a given displacement, and of that indicated by simulation programs (in my case, HornResp, though I'm sure other programs such as WinISD would indicate the same).
To be exact, it's a difference of 3dB. My explanation for this is that Dr. Small was calculating for peak values rather than RMS. So a 1000cm^3 driver will not be able to produce a 20Hz sine wave which measures 103.5dB, but rather only 100.5dB.
In other words, if you actually want 103.5dB RMS at 20Hz, you also need a driver that will displace 1000cm^3 RMS, or peaks of 1414cm^2.
Please correct me if I am mistaken here, but if not, this is probably helpful to point out, lest there are misconceptions when laying out a speaker for bass reproduction.
- Status
- Not open for further replies.
- Home
- Loudspeakers
- Multi-Way
- Volume Displacement For SPL Chart