Hello,
At first I wanted to measure the speakers in the cabinet (impedance and SPL) and use the data in Vituix CAD to build my three-way crossover.
Now I have started to build the crossover but the simulation does not match the reality. I started with the 12dB bass section and luckily I have different coils to change something.
Long story short.
Now I want to simulate the same crossover with the SPL Trace data from the manufacturer's data sheets to see if it fits better.
First of all I have two questions:
1. under crossover/ driver there is X,Y,Z, but what is 0mm in orientation in space? I have to say that the instructions in English don't make it any easier for me.
I am very familiar with technical drawings as I have a lot to do with them, but I can't figure out where the 0mm starts.
Is 0 mm the bottom edge of the speaker or the center of the tweeter or the listening position or what the heck do you put there for tweeter, midrange and bass in a three way configuration?
2. diffraction.
Why is it possible to enter the position of the drivers once under Speakers and then also in the Diffractions tool? Normally you enter the speaker positions either under Diffraction or under Speakers. But not twice, that doesn't make sense to me.
So I'm having problems entering the raw data correctly.
My plan for the bass section is to simulate the cabinet first (with the T/S parameters).
Then I want to open this data in the Diffractions Tool and simulate the baffle.
This way I have created the impedance and SPL for the bass without having to use the SPL Trace Tool.
Next, I load the data as a generated text file for midrange and tweeter (extracted from the manufacturer data (SPL/Impedant)
Since the midrange driver and the tweeter already behave in the cabinet as if they were in an infinite baffle, do I not need the Diffractions Tool at all?
But then I have the problem of where does X,Y,Z begin...
Take the X, Y, Z on the crossover tab as relative dimensions. They change the position of the drivers relative to each other but they don't represent the baffle. The baffle response is encoded in the polar measurements. It all boils down to what they're there for, which is only for creating blended polar data as well as adjusting relative level and phase, while considering subtle differences in the angle for each driver to the listening position.
The baffle tool is different. It needs the baffle position to calculate edge delay data. However once that's done, it's encoded in the new polar data and forgotten.
So you can see there isn't a complete virtual baffle construct on the crossover tab.. only the aspects of it that are necessary for the job.
The 0 represents the listening axis or reference axis. If you intend to listen at tweeter level it is the centre of the tweeter. If you want to listen halfway between mid and tweeter that is 0. The other drivers or dimensions are then offset positive or negative relative to your chosen 0 point. In the Z direction normally the baffle is the 0 point.
You should then be able use the drawings in the measurement instructions to visualize which direction positive or negative is more easily.
The diffraction tool is separate to the main crossover simulator. They are not tied together, if you want to use them together then the positions need to match to have the most accuracy.
If I place the microphone between the tweeter and midrange in the Diffractions Tool, that is the zero point.The diffraction tool is separate to the main crossover simulator. They are not tied together, if you want to use them together then the positions need to match to have the most accuracy.
I start from this zero point to position the speakers (on the crossover side, speakers #1, #2, #3...): Tweeter X0mm, Y+50mm, Z0mm; Midrange X 0mm, Y-70mm, Z0mm etc.?
If I use the manufacturer's data, does it always start from the baffle when measuring? So Z is always 0mm (if all speakers are mounted on one level)?
That should be "if all speakers are measured on one level".(if all speakers are mounted on one level)?
It's your measurement setup that matters.
For manufacturer data you cannot be sure, but z=0 probably is your best guess.
Your information was on point, I really appreciate that.
Thank You all!
Chat a little more...
The difficulty with my own measurements is the influence of space.
I can imagine getting a better result if I use the manufacturer's instructions.
1. Essential baffle without room influences.
2. Volume is stated at 2.83 volts.
3. I can simulate the influence of the baffle.
4. I can try different positions.
5. A ribbon with transformer and capacitor measured with REW provides incorrect information about phase and measuring distance.
If you continue to use it with those in place then it remains valid.5. A ribbon with transformer and capacitor measured with REW provides incorrect information about phase
If you want to work on the crossover without the capacitor, but you measured with it in place, you can reverse engineer the result using the simulator.
The measuring distance information is embedded in the phase data so there's no problem. You don't ordinarily need to know the amount. You don't change the driver depth position in Vituixcad if they are on the same baffle.
Yes that sounds rightIf I place the microphone between the tweeter and midrange in the Diffractions Tool, that is the zero point.
I start from this zero point to position the speakers (on the crossover side, speakers #1, #2, #3...): Tweeter X0mm, Y+50mm, Z0mm; Midrange X 0mm, Y-70mm, Z0mm etc.?
As stv mentioned if you follow the measurement instructions the relative phase will be included in real data.If I use the manufacturer's data, does it always start from the baffle when measuring? So Z is always 0mm (if all speakers are mounted on one level)?
If you use manufacturers data there will be no relative phase. Using z=0 for all drivers will not produce a simulation that matches reality very well. You can guess the approximate depth of the voice coil for different size speakers and see the effect by changing the relative z positions but you might guess wrong and then reality won’t match. Using manufacturers data is from a time where crossovers were designed with single axis data. With Vituix today so much more can be done with full or partial polar measurements.
Making good measurements is not easy manufacturers don’t always do a good job either so you cannot take their measurements as being a source of truth.The difficulty with my own measurements is the influence of space.
Using a combination of near field and Far field measurements gating and merging usually gives the best results when measuring indoors in normal size rooms ie quite small.
You will do better learning to measure properly yourself. The influence of the baffle and the relative phase between the drivers is really important to design a good crossover. Those are the things that become somewhat of a guess with manufacturers data.I can imagine getting a better result if I use the manufacturer's instructions.
1. Essential baffle without room influences.
2. Volume is stated at 2.83 volts.
3. I can simulate the influence of the baffle.
4. I can try different positions.
5. A ribbon with transformer and capacitor measured with REW provides incorrect information about phase and measuring distance.
Using only the manufacturer's data and the impedance from the database, I soldered together a crossover and the transition and the volume between the bass and the mid-range have been perfect so far.
Only the tweeter was much too loud and the separation to the midrange was too far apart. It would have been too easy if the crossover had been perfect right from the start. Now I'm doing the engineering in reverse by swapping components and measuring and then comparing the measurement with Vituix. But on the main I have made good progress today.
A couple of coils are missing to finish the crossover. When I start unwinding the wire it could be ready tomorrow. 😎👍

Hello,
Since there is a group of experts here at the moment, I have a small off-topic question.
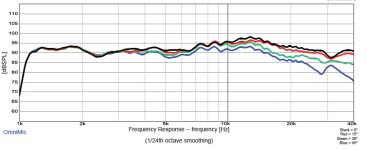
Let's say my frequency response looks like this in real life:

The ribbon from GRS (GRS RT 2.0-8) has a strong rise from 6-7 KhZ.
In real life it is even stronger at + 10 dB and is also present at an angle.
I am considering going back to the Fountek NeoCD3.5H.
I have also tried this and the increase is not so strong and you can angle the speakers slightly to reduce the treble.
But I could also counteract the rise with a notch filter.
All ribbons have this rise at high frequencies, is it actually the rule to always install a notch filter (or similar) there and does this have negative effects on the sound?
What would you do, go back to the Fountak or level out the rise with a filter?
Since there is a group of experts here at the moment, I have a small off-topic question.
Let's say my frequency response looks like this in real life:
The ribbon from GRS (GRS RT 2.0-8) has a strong rise from 6-7 KhZ.
In real life it is even stronger at + 10 dB and is also present at an angle.
I am considering going back to the Fountek NeoCD3.5H.
I have also tried this and the increase is not so strong and you can angle the speakers slightly to reduce the treble.
But I could also counteract the rise with a notch filter.
All ribbons have this rise at high frequencies, is it actually the rule to always install a notch filter (or similar) there and does this have negative effects on the sound?
What would you do, go back to the Fountak or level out the rise with a filter?
It's often advisable to listen at other than 0 degrees. Often this can be achieved by crossing them in front of you. This is because the speaker power response is usually more compatible with an off-axis angle.
The other thing is you should also equalise with consideration to the power, and not necessarily strictly to your response measurement unless you're looking at that compatible angle.
The other thing is you should also equalise with consideration to the power, and not necessarily strictly to your response measurement unless you're looking at that compatible angle.
It's often advisable to listen at other than 0 degrees. Often this can be achieved by crossing them in front of you. This is because the speaker power response is usually more compatible with an off-axis angle
Even at 30 degrees, the GRS is still very high-pitched.
Here is an excerpt from the PDF (in real life the increase can be even greater).
A height axis of say 15-20 degree would be good, because I have noticed that the HIVI DM-7500 has less distortion at an angle than on axis.
Attachments
I'm not sure whether the advice given by the previous posters has really been understood. That's why I'd like to summarise this briefly, possibly with further hints:
For the sake of simplicity, I assume a flat, vertical baffle on which all drivers are mounted. There are two methods for making (gated) far-field measurements of the individual drivers of a multi-way speaker. Using a timing reference is strongly recommended in any case:
The simpler one is to measure all drivers from one point. The measurement distance should not be too small (ideally the future listening distance of the finished loudspeaker, but it's difficult to achieve in normal measuring rooms) and the vertical extension of the speaker should not be too large. The measurement is then taken on the selected listening axis, e.g. at the height of the tweeter. Because there is a timing reference all phase data is already included in the measurements. Changing the X/Y/Z coordinates would then even cause damage, the simulation of crossovers at the crossover points would no longer be correct.
The more difficult method is to measure each driver on its own axis at the same distance from the front baffle (!). This is actually the more correct method. You then select your listening axis (e.g. at the height of the tweeter) and, based on this, specify the offset of the drivers on the Y-axis relative to this axis, and possibly also to the X-axis if there is a vertical offset of the drivers on the baffle. The Z-axis remains unaffected. In contrast to the first method, it is then possible to carry out the simulation for any listening distance.
If traced data is taken from manufacturer data sheets, there is no phase data at all. For this reason alone, a correct simulation of a crossover is hardly possible with such data. The virtual shifting of the drivers in the X/Y/Z coordinate space is also of little use, because it is almost impossible to determine exactly where the sound origins of the individual drivers are, especially as they can (and will) change with the frequency because phase responses are not linear in most cases.
In addition, the influences of the enclosure are not included in the manufacturer's data: Influences of the baffle or the cabinet tuning of cone drivers on frequency and impedance responses are not taken into account.
Please correct me if there are any mistakes in my thoughts on this. 🙂
Last edited:
Hello,
I'm already working on the crossover and trying out different components.
In the end, there will be no getting around an outdoor measurement with a good distance to the ground.
The lack of phase in the manufacturer's data is less of a problem than the edge reflection.
In my opinion, you can proceed as follows.
First a simulation with the manufacturer's data in Vituix CAD ( simply set the distances in the software).
Then you build a cabinet and measure all three drivers at the listening position. The edge reflections are then already included in the measurement.
Then you order the coil and the capacitor for the bass and measure the frequency response. Then compare this measurement with the result from Vituix CAD.
If the volume at the peak (the loudest point in the amplitude) matches, you can then adjust the rest of the crossover parts and order them.
In any case, I could not avoid changing capacitors and coils because the simulation did not correspond to reality. For the next time I know how to minimize the exchange of components.
You need a lot of experience to ensure that the simulation later matches the measurement exactly. Some effects are stronger or less strong in reality than in the simulation.
The easiest way is to have a bunch of coils and capacitors in stock and swap them until you are satisfied with the result 🙂
It's a very common approach. Even those with experience reach a point..The easiest way is to have a bunch of coils and capacitors in stock and swap them until you are satisfied with the result 🙂
However it's much more productive if you can tell, and keep separate, whether it's the blend/cross that is getting/needing the attention or the overall voicing.
You can simulate this in vituixcad.is less of a problem than the edge reflection.
Have a look here:
https://www.gazza-diy-audio.de/simulation-crossover/hts-mit-vituixcad-perfekt-positionieren/
Yes but,You can simulate this in vituixcad.
You can only do something with it with experience.
e.g. my cabinet edge produces a small bump at ~400 Hz that I would have preferred to see at ~500 Hz.
These little things are more noticeable in the outdoor measurement than in the simulation. It's not a big problem, but I'm not happy with it and that's why my cabinet is now getting smaller.
- Home
- Loudspeakers
- Multi-Way
- Vituix CAD what is X,Y,Z?