I understand (I think) how to draw a loadline on the tube characteristics for a given load. The characteristics one can get from the data sheets for various operating conditions. Now if you have a pentode or beam tetrode, you can tie g2 to a fixed voltage (pentode mode) or to anode (triode mode), or to a tap of the output transformer at a certain percentage (ultralinear mode).
Imagine that you have a kind of Variac output transformer, where you can continuously adjust the g2 tap between 0% (tied to B+) and 100% (tied to the anode). It will realize a continuous shift between pentode mode and triode mode. Or perhaps better said a variable local feedback to g2.
How could I draw the loadline for a given percentage of g2 tap?
There isn't a set of tube characteristics for UL in general. One set apply only to a one % of UL tap and a supply voltage. If you change one of those the characteristics change too. So you have to determine the graphics for a special case and draw a loadline.
Mona
Mona

No, at least not for UL. Without signal Va=Vg2. If Va goes up Vg2 follows with a x% above Vb, Va allways higher then Vg2. And when Va drops Vg2 goes down a x% less and Vg2 gets more positive then Va.
Mona
Mona
So how did the engineers create the UL characteristic plots shown in the tube data sheets? I've also wondered this could be done.
Seems like you'd need the actual output transformer in question connected to the power tube, with the output stage properly powered and biased, then apply different amplitude AC signals to its grid and measure the AC plate volts and plate current. I've not tried this but this seems like what you'd need to do.
Or is there an easier or better way to do it (without using a simulator)?
Hi kward,
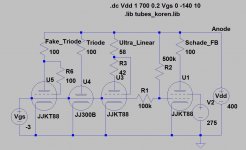
That´s rather easy, indeed: Additionally to the basic setup you would use to plot the plate curves you only need an additional potentiometer to set the UL ratio and an additional floating power supply to set the Eg2 to Ea offset voltage. That´s all to it.
Have a look at the attached file. Although it is in German language, the math should be pretty obvious (hint: "SGK%" maps to UL ratio), as well as the measuring setup shown on the 2nd page.
Kind regards, Tom Schlangen
So how did the engineers create the UL characteristic plots shown in the tube data sheets? I've also wondered this could be done.
That´s rather easy, indeed: Additionally to the basic setup you would use to plot the plate curves you only need an additional potentiometer to set the UL ratio and an additional floating power supply to set the Eg2 to Ea offset voltage. That´s all to it.
Have a look at the attached file. Although it is in German language, the math should be pretty obvious (hint: "SGK%" maps to UL ratio), as well as the measuring setup shown on the 2nd page.
Kind regards, Tom Schlangen
Attachments

Good for dynamic & distortion measurements, indeed! But very special OPT allows only for stepped ratio measurements. Anyway, thank you!
Tom
Tom
That's not about UL with an output transformer.Hi kward,
That´s rather easy, indeed: Additionally to the basic setup you would use to plot the plate curves you only need an additional potentiometer to set the UL ratio and an additional floating power supply to set the Eg2 to Ea offset voltage. That´s all to it.
Have a look at the attached file. Although it is in German language, the math should be pretty obvious (hint: "SGK%" maps to UL ratio), as well as the measuring setup shown on the 2nd page.
Kind regards, Tom Schlangen
Ug2,fix=Ua*(1-SGK%/100) is allright with a resistor divider, but with a transformer you get Ug2,fix=Ua. The bias condition is the same as with triode-strapped. Also with the resistors Ug2 is always lower then Ua. This is not the case with a transformer.
Mona
Probably the angle of the Ia/Va curve depends on the g2 tap ratio. 0% tap = pentode mode, horizontal lines, 100% tap = triode mode, y degrees angle. x% tap = UL mode, y/x angle.
Hi Mona,
the question was how to plot UL plate curves, and you will get perfectly valid UL plate curves doing (lots of) statical measurements the way I showed up.
Huh? With an xfmr, plate and screen taps are in phase, hence Ug2 always will be < Ua for conditions of UL ratios < 100%, that´s just like (auto-) xfmrs work.
Your objection only holds true for UL ratios > 100%, which is rarely the case (there are a very few real world implementations, though).
Kind regards, Tom
the question was how to plot UL plate curves, and you will get perfectly valid UL plate curves doing (lots of) statical measurements the way I showed up.
Also with the resistors Ug2 is always lower then Ua. This is not the case with a transformer.
Huh? With an xfmr, plate and screen taps are in phase, hence Ug2 always will be < Ua for conditions of UL ratios < 100%, that´s just like (auto-) xfmrs work.
Your objection only holds true for UL ratios > 100%, which is rarely the case (there are a very few real world implementations, though).
Kind regards, Tom
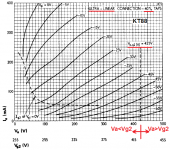
For UL the starting point is Vb=Va=Vg2. If Va goes up from the starting point Vb for ΔV, Vg2 goes up x%ΔV from Vb. Result Va>Vg2. If Va goes down from Vb for ΔV, Vg2 goes down only x%ΔV from Vb. Result Va<Vg2.
Have a look at the UL curves from Genalex.
Mona
Have a look at the UL curves from Genalex.
Mona
Attachments
Last edited:
The actual way the tube UL curves were plotted is with the Tek 570 curve tracer.. The 6550A and 5881 UL curves you see in the Tung-Sol data sheets are from a Tek 570 and a UL transformer hooked up...
There is a way to do it mathematically and graph it... Not mush different than plotting cathode curves from plate curves.. They made OT with various UL taps...they kind of experimented till they came across optimum operating points...
There is a way to do it mathematically and graph it... Not mush different than plotting cathode curves from plate curves.. They made OT with various UL taps...they kind of experimented till they came across optimum operating points...
If you want single-ended curves (which can always be flip-flopped to give push-pull curves): put a Variac across the load choke and feed screen from there. Variac will give <1% steps. For higher voltage tubes you want to work above 50/60Hz to be sure the Variac doesn't saturate. In any case the Variac MUST be fully insulated from case because there will be high voltage on all three legs.
uTracer ( dos4ever.com ) have a mode to create UL charactaristics
The uTracer, a miniature Tube Curve Tracer / Tester.
The uTracer, a miniature Tube Curve Tracer / Tester.
- Home
- Amplifiers
- Tubes / Valves
- UL loadline