I hope I didn't misunderstand your posts.
Ray K
This is a very important signal processing point that we have to be clear on. The traditional definition of IM is due to the simple multiplication of two frequencies by a gain that is not constant with level. The harmonics are at the sum and difference frequencies in a geometric progression. FM has to be at the same sum and difference frequencies because you can not create non harmonically related frequencies in a weakly nonlinear system, but follows a relationship determined by the Bessel series. The phase relationships of the two make them separable, but FM detectors are designed to have lots of AM rejection so that information is lost.
Ray,
You are absolutely right.
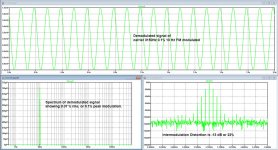
In image below I have combined FM and IM all together for a 3150 Hz carrier, 0.1% FM modulated with 10 Hz.
The upper part of the image shows the demodulated FM signal, where again 1mV represents 0.1% FM modulation.
Left below is the spectrum of this signal, showing 700uV rms or 0.07% FM modulation rms at 10 Hz.
So far everything as expected.
But lower right shows the spectrum of the original FM modulated 3150 Hz signal.
Here you see all IM sidebands because of this FM modulation.
Adding the power of those IM sidebands, gives and IMD of -13dB or 22%.
This conforms quite well with the pictures in the original B&K documents.
Hans
You are absolutely right.
In image below I have combined FM and IM all together for a 3150 Hz carrier, 0.1% FM modulated with 10 Hz.
The upper part of the image shows the demodulated FM signal, where again 1mV represents 0.1% FM modulation.
Left below is the spectrum of this signal, showing 700uV rms or 0.07% FM modulation rms at 10 Hz.
So far everything as expected.
But lower right shows the spectrum of the original FM modulated 3150 Hz signal.
Here you see all IM sidebands because of this FM modulation.
Adding the power of those IM sidebands, gives and IMD of -13dB or 22%.
This conforms quite well with the pictures in the original B&K documents.
Hans
Attachments
Thanks for putting everything so neatly together, results are similar.Here's my submission, in summary form, attached.
Looking at FM variation of the 3kHz carrier in the time domain, using polar plot format. For these plots, tramlines are at 0.2% spacing and all plots have same scale. Inset spectrum graphs have the same scale for all plots so can be compared directly.
All is not as clear and well as one might expect or hope.........isn't life just like that sometimes....? Perhaps the adjacency of the 2nd carrier, perhaps phase artifacts of whatever audio compression was in the youtube source file.......?
LD
That saves me the effort for doing the last 4 frequencies from 11 to 14 Hz.
The reason why I did this in the first place was because we had the discussion whether it makes sense to combine a 3150 Hz carrier with a sweep from 5 to 25 Hz.
Looking at our results, I think that the answer is that it does not seem to bring very much to put something like this on the test LP.
The only nice thing made visible here is that a brush effectively dampens the movement of Cart/Arm and reduces the FM modulation because of that.
Hans
I've been thinking about this result over the past day or so. I think it's odd.
IIRC, on the 'Mechanical Resonance' thread (which I can no longer find, BTW ??!!?? help appreciated), a different test record produced very clear resonance results which showed up in time domain FM analysis polar plots very well. That was a monotone carrier mixed with LF spot frequencies, again IIRC.
However, this Shure TTR117 test on this rig in the youtube video, even visually and audibly in the youtube video, appears to cause the headshell to vibrate significantly at all test frequencies from 5Hz to 14Hz. And this shows up as FM, as it should, in both the FM polar plot and Han's IM analysis. Yes, there seems to be some resonant behaviour ~ 11Hz, but not as pronounced as should be in principle, and masked by presence of what appears to be headshell motion in response to the lf test frequency - which shouldn't happen to any meaningful extent except near to resonance.
Neither is there much 600Hz IM between the two carrier tones, only barely audible and not easy to fish out of the spectrum.......
Any insight into how the test track is meant to work ? Is there already 5-14Hz IM synthesised on one or both of the carrier tones? That might explain it......
Confused, Yoda is.
LD
That's my feeling also, so I have already spent quite some time on further analysis.I've been thinking about this result over the past day or so. I think it's odd.
For one thing, it was easy to reconstruct that a 18dB/oct@15 Hz Rumble filter had been used, so I corrected the files for that.
But even then, things are not that easy to reconstruct.
Waving of the input signal is almost all the time in antiphase between L and R, so the FM modulation is almost exclusively caused by vertical movement, which makes sense.
But the correlation between both is not that obvious when concerning it as a second order system with a certain Q.
This was e wav file that George had supplied. I'm using it as a reference against this Shure 45 RPM recording.IIRC, on the 'Mechanical Resonance' thread (which I can no longer find, BTW ??!!?? help appreciated), a different test record produced very clear resonance results which showed up in time domain FM analysis polar plots very well. That was a monotone carrier mixed with LF spot frequencies, again IIRC.
If you can wait one or two days, I might be able to tell what my analysis has brought, if any.
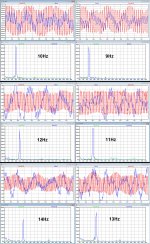
In the meantime you can have a look at both images below.
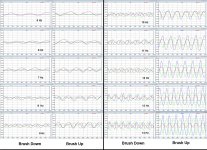
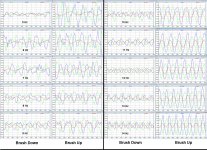
From all 10 frequencies you can see the Waving of the input signal for L / R in Green / Blue and the demodulated FM signal in Red.
Image on the left is uncorrected, on the right waving corrected for the rumble filter.
Hans
p.s. so far the waving is only corrected in amplitude but not yet in phase !
Attachments
Last edited:
George,
What's the lower -3dB point of your recording chain, from TT to digital.
My question is because it effects the waving of the signal in the .wav file.
Hi Hans
The wav. files in post # 846 (M97xE brush up-brush down) have not come from my system.
I simply ripped them from youtube (address link provided).
Mp3 to wav (16b/44.1kHz) was done through Audacity.
So I can not give you an answer as to the HP –3dB freq point.
George
Neither is there much 600Hz IM between the two carrier tones, only barely audible and not easy to fish out of the spectrum.......
I did it by accident once and used 6300Hz instead of 3150 and it worked fairly well even though far lower in amplitude. Using the rftt() & irfft() built into any of the math libs makes the prefiltering easy.
Thank you, Bill. I've bookmarked that now.LD: Thread you want starts here mechanical resonance in MMs
Although what I was looking for turned out to be on the Speed Stability thread, it provided helpful pointers.
The post I was looking for, which previously showed the resonance clearly in polar plot FM format in response to differing LF stimulus, was #130 here http://www.diyaudio.com/forums/analogue-source/309349-turntable-speed-stabilty-13.html#post5129823 presenting results with/without a longhorn mod.
The posts there suggest a very different result from that suggested here. Using a different test track stimulus, but a similar cartridge.
LD
Last edited:
Dropbox - lateral resonance test.wav
Dropbox - vertical resonance test.wav
Here are two original wav files for my arm/cartridge resonance frequency tests. Please use your software to analysis them. For lateral resonance, the lowest frequency is 6 Hz on the test lp. My arm/cartridge resonance frequency is around 4-5 Hz, so it does't show. Pilot frequency is 1 kHz.
Trying to find the transfer function from relative Cantilever movement to Carrier FM modulation, I assumed scrubbing as being the most important reason and further concentrated on the Brush Up recordings only.
And indeed,waving of the input signal between L and R channel was almost all the time in opposite phase, confirming massive vertical movement.
To extract the vertical movement, both channel signals were subtracted.
Since the demodulated signal that originally FM modulated the carrier, was in the same order of magnitude from 5 to 14 Hz, it meant that the vert. waving had to be at least of similar amplitude over the same freq. range, but it was not.
The only reason could be a rumble filter being used when recording the .wav files.
So an anti-rumble filter was applied and after some experimenting it seemed like an 18dB/oct filter @ 25 Hz was the right choice.
Next step was to find the additional transfer function between the anti-rumble corrected waving signal and the FM demodulated signal.
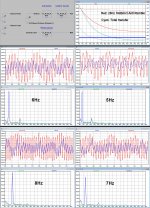
Again a number of attempts showed this transfer function could be realised. See first image below for the Circuit and also the Bode diagram showing the AntiRumble filter alone in red and the complete transfer function in Cyan.
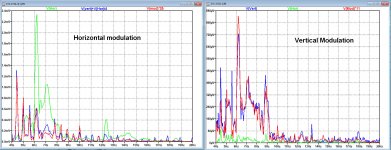
The 2 large images are further showing the spectra of the vertical Waving in blue called “V(Vert)” after having applied the complete transfer function,versus the spectra of the signal “V(Mod)” in red, being the FM demodulated signal from the 2990 Hz carrier.
Spectra are computed from the time signals directly above, taken from 3 LP revolutions or 4seconds at 45 rpm.
The used FM demodulator, could manage up to +/- 0.7 % FM modulation, way above the auditorythreshold of 0.1%.
And because V(mod) exceeded occasionally of this hard limit, there is some extra noise oflow magnitude in the spectra of 10 and 11 Hz.
These noise artefacts are not really important for this analysis. It does in no significant way affect H1 and H2 of the signal V(mod).
V(mod) in all spectra is multiplied by 100 and V(Vert) on average by 2.7 to get their respective H1's at equal amplitude.
The deviation from this factor 2.7 for the frequencies from 5 till 14 Hz is +/- 0.5dB, so the constructed transferfunction fits remarkable well ! But the harmonics from 22 Hz and up are too low, so the total transfer should stop at-10dB instead of the used -20 dB, a difference of a factor 3, bringing the higher harmonics right where V(mod) is now. That’s why the blue line is drawnin the transfer function graph, to show where the attenuation should really stop.
For the lower frequencies from 5 to 10 Hz, their H2 lies exactly on top ofV(mod), so up to 20 Hz the transfer curve is correcting properly.
Conclusions:
And indeed,waving of the input signal between L and R channel was almost all the time in opposite phase, confirming massive vertical movement.
To extract the vertical movement, both channel signals were subtracted.
Since the demodulated signal that originally FM modulated the carrier, was in the same order of magnitude from 5 to 14 Hz, it meant that the vert. waving had to be at least of similar amplitude over the same freq. range, but it was not.
The only reason could be a rumble filter being used when recording the .wav files.
So an anti-rumble filter was applied and after some experimenting it seemed like an 18dB/oct filter @ 25 Hz was the right choice.
Next step was to find the additional transfer function between the anti-rumble corrected waving signal and the FM demodulated signal.
Again a number of attempts showed this transfer function could be realised. See first image below for the Circuit and also the Bode diagram showing the AntiRumble filter alone in red and the complete transfer function in Cyan.
The 2 large images are further showing the spectra of the vertical Waving in blue called “V(Vert)” after having applied the complete transfer function,versus the spectra of the signal “V(Mod)” in red, being the FM demodulated signal from the 2990 Hz carrier.
Spectra are computed from the time signals directly above, taken from 3 LP revolutions or 4seconds at 45 rpm.
The used FM demodulator, could manage up to +/- 0.7 % FM modulation, way above the auditorythreshold of 0.1%.
And because V(mod) exceeded occasionally of this hard limit, there is some extra noise oflow magnitude in the spectra of 10 and 11 Hz.
These noise artefacts are not really important for this analysis. It does in no significant way affect H1 and H2 of the signal V(mod).
V(mod) in all spectra is multiplied by 100 and V(Vert) on average by 2.7 to get their respective H1's at equal amplitude.
The deviation from this factor 2.7 for the frequencies from 5 till 14 Hz is +/- 0.5dB, so the constructed transferfunction fits remarkable well ! But the harmonics from 22 Hz and up are too low, so the total transfer should stop at-10dB instead of the used -20 dB, a difference of a factor 3, bringing the higher harmonics right where V(mod) is now. That’s why the blue line is drawnin the transfer function graph, to show where the attenuation should really stop.
For the lower frequencies from 5 to 10 Hz, their H2 lies exactly on top ofV(mod), so up to 20 Hz the transfer curve is correcting properly.
Conclusions:
- It is possible to construct a transfer function from the vertical waving, correlating completely with the FM demodulated signal.
- The Anti Rumble filter was guessed to be a Butterworth filter at 25Hz@18dB/oct. Although this can’t be far off, the total transfer was spot on until 20Hz.
Changing the Anti Rumble transfer will immediately alter the additional transfer function in order to keep total transfer function unaffected.
- Assuming for a moment that the AntiRumble filter is correctly chosen, it is easy to see in the transfer graph that starting from 6 Hz, the effect of vertical Waving on FM modulation gets gradually lesser up to a factor 3 as from ca. 20 Hz and beyond.
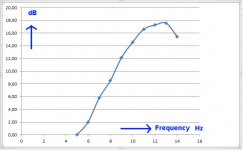
- This is thus a good reason trying to let Fres at 10 Hz or even higher.
- The transfer curve calculated here makes it plausible that Fres for this specific system lies somewhere around 13Hz, calculated from the amplitude of Vmod, multiplied by the attenuation between total transfer curve minus the Anti Rumble curve.
Graphically this results in the third image below, showing the transfer curve of the cartridge from 5 to 14 Hz. Unfortunately there is no info above this frequency, so it is impossible to tell what the Q of Fres of this Cart/Armcombination is.
And of course this is still assuming that the Anti Rumble curve is correct.
Hans
Attachments
Since nobody else took action, I had a quick look at your files.Dropbox - lateral resonance test.wav
Dropbox - vertical resonance test.wav
Here are two original wav files for my arm/cartridge resonance frequency tests. Please use your software to analysis them. For lateral resonance, the lowest frequency is 6 Hz on the test lp. My arm/cartridge resonance frequency is around 4-5 Hz, so it does't show. Pilot frequency is 1 kHz.
The vertical wav file looks very wrong.
L and R channel are exactly in phase, and so is the waving of the signal.
The lateral wav file looks O.K. with L and R in phase and waving in opposite phase.
Hans
Hans,
Thanks for taking your time to examine the files!
I checked the files again and found I made a mistake. The vertical file is actually lateral one and lateral file should be vertical. Both tracks are from Hi-Fi New Test LP, band 2 and 3.
I am not sure why you said the vertical file(actually it is lateral) is very wrong. Can you explain it?
Jim
Hans,
Thanks for taking your time to examine the files!
I checked the files again and found I made a mistake. The vertical file is actually lateral one and lateral file should be vertical. Both tracks are from Hi-Fi New Test LP, band 2 and 3.
I am not sure why you said the vertical file(actually it is lateral) is very wrong. Can you explain it?
Jim
O.K., I switch them.
Come back with further comment.
Hans
I was having a discussion yesterday about the Moerch DP8 tonearm and the fact that it uses outriggers to increase inertia in the horizontal plane. Moerch claims this allows a high vertical resonance in the vertical plane but control in the lateral to help LF response. I don't necessarily buy the benefit, but figured that a linear tracker should have a similar difference in vertical and horizontal effective mass.
Hans, have you seen a significant difference in Fres between planes on your arm?
Hans, have you seen a significant difference in Fres between planes on your arm?
Yes, Indeed.I was having a discussion yesterday about the Moerch DP8 tonearm and the fact that it uses outriggers to increase inertia in the horizontal plane. Moerch claims this allows a high vertical resonance in the vertical plane but control in the lateral to help LF response. I don't necessarily buy the benefit, but figured that a linear tracker should have a similar difference in vertical and horizontal effective mass.
Hans, have you seen a significant difference in Fres between planes on your arm?
Here are the results
Attachments
Jim,Hans,
Thanks for taking your time to examine the files!
I checked the files again and found I made a mistake. The vertical file is actually lateral one and lateral file should be vertical. Both tracks are from Hi-Fi New Test LP, band 2 and 3.
I am not sure why you said the vertical file(actually it is lateral) is very wrong. Can you explain it?
Jim
Here are the results for your system.
In the lateral spectrum you see a very large peak in green, slightly above 6Hz, being Fres.
The demodulated FM signal in red, is almost exclusively caused by the vertical waving.
In the vertical spectrum, Fres vert in blue is also at slightly above 6Hz.
The demodulated FM signal in red is again almost exclusively caused by the vertical movement.
Hans
Attachments
Thank you Hans. That actually clears up many things, not least that Moerch were using the adjust plus software as their graphs have the same spelling feature on the horizontal axis!
The Moerch results look very nicely damped until you note the scale squishing http://www.moerch.dk/files/DP-8 Resonance Test 01.pdf
Nevertheless an interesting datapoint, albeit on an arm I would never be able to justify!
The Moerch results look very nicely damped until you note the scale squishing http://www.moerch.dk/files/DP-8 Resonance Test 01.pdf
Nevertheless an interesting datapoint, albeit on an arm I would never be able to justify!
I was having a discussion yesterday about the Moerch DP8 tonearm and the fact that it uses outriggers to increase inertia in the horizontal plane. Moerch claims this allows a high vertical resonance in the vertical plane but control in the lateral to help LF response. I don't necessarily buy the benefit, but figured that a linear tracker should have a similar difference in vertical and horizontal effective mass.
Hans, have you seen a significant difference in Fres between planes on your arm?
I don't personally believe that heavy horizontal mass helps bass. I did my resonance tests to approve that an air bearing linear arm such as mine can have very similar or same vertical and horizontal resonance frequencies although its vertical and horizontal masses are different. I don't know the reason why its resonance frequencies are almost same while its masses are different. However, I approved that under the construction of my arm, an air bearing linear arm can have almost same resonance. Therefore, the criticism about difference of vertical and horizontal masses of air bearing linear arms is unfounded.
Jim,
Here are the results for your system.
In the lateral spectrum you see a very large peak in green, slightly above 6Hz, being Fres.
The demodulated FM signal in red, is almost exclusively caused by the vertical waving.
In the vertical spectrum, Fres vert in blue is also at slightly above 6Hz.
The demodulated FM signal in red is again almost exclusively caused by the vertical movement.
Hans
Hans,
So, why is that? FM is only caused by vertical movement even for horizontal module. What does this mean for my arm in reality?
Jim
- Home
- Source & Line
- Analogue Source
- Turntable speed stabilty