Hi
I recently use a Tiepie HS5 usb oscilloscope.
I'm trying to measure the response of amp, output transformer or filter.
Apparently there is no fast tool for bode plot (phase and magnetude response measurement).
I find a solution for magnetude response/fréquency with "Math" tools but nothing for phase response
Is anyone using another solution ?
Thanks for help
Yan24
Hi
Nobody knows this
Pearhaps different brands have software with the same shortcomings
Thanks for help
Nobody knows this
Pearhaps different brands have software with the same shortcomings
Thanks for help
The Bode plot function I use was only available to HS3 on Win XP software.
Only magnitude, no phase.
I believe there is a Win 7 version which is "unofficial" and only available from Tie Pie on request.
But it does not support frequency plot on a log scale.
So I am still using Win XP with my HS3.
Not sure if compatible with HS5.
Best to ask Tie Pie direct.
Patrick
Only magnitude, no phase.
I believe there is a Win 7 version which is "unofficial" and only available from Tie Pie on request.
But it does not support frequency plot on a log scale.
So I am still using Win XP with my HS3.
Not sure if compatible with HS5.
Best to ask Tie Pie direct.
Patrick
Hi
Many thanks for your answer.
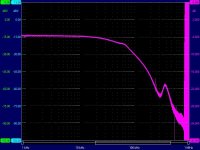
I've found a solution for the bandwidth and she works with de hs5 on win11.
I'll ask directly Tiepie for phase response.
Here a screenshot with hs3 demo
Quick setup / spectrum analyser / circuit sweep /...
Many thanks for your answer.
I've found a solution for the bandwidth and she works with de hs5 on win11.
I'll ask directly Tiepie for phase response.
Here a screenshot with hs3 demo
Quick setup / spectrum analyser / circuit sweep /...
Attachments
Hi
After asking TIEPIE.
here is their answer
"Tiepie have this tool available on request, supporting Handyscope HS3,
Handyscope HS5 and WiFiScope WS5, for Win 10, 11.
the software can be downloaded from
https://download.tiepie.com/Customers/Bode/BodePlot-1.7.2.zip
Unzip it and place all contents in a folder on your computer.
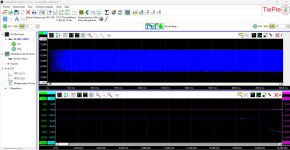
This tool work fine and I've appréciate the reactivity off Tiepie service, very professional
bravo.
After asking TIEPIE.
here is their answer
"Tiepie have this tool available on request, supporting Handyscope HS3,
Handyscope HS5 and WiFiScope WS5, for Win 10, 11.
the software can be downloaded from
https://download.tiepie.com/Customers/Bode/BodePlot-1.7.2.zip
Unzip it and place all contents in a folder on your computer.
using external applications like Excel. "When started, it will suitable instruments. When one is found, it will be opened.
When more are found, you will get a section dialog for which instrument to use.
The program can generate a frequency sweep using the function generator, between an adjustable
start- and stop frequency, in an adjustable amount of steps. Both a linear and logarithmic frequency
change are possible (switching to the other mode requires a new measurement). The signal type is
(obviously) a sine wave, the amplitude is adjustable.
The program expects Ch1 to be connected to the generator output and Ch2 to the output of the circuit
under test.
The program measures gain in dB and the phase angle in pi radials. Gain axis is auto ranging, just
as the inputs Ch1 and Ch2.
While measuring, the program can show the following information:
- Scope images of Ch1 and Ch2, the full record
- Scope images of Ch1 and Ch2, zoomed in at the first cycle on Ch1
- Gain graph
- Phase angle graph
Using the [WinSet] button toggles between different settings.
After performing a measurement, the results can be saved to a CSV file, which can then be examined
This tool work fine and I've appréciate the reactivity off Tiepie service, very professional
bravo.