Again Conrad hit the nail on the head commenting that the phase of the voltage and current in and across the speaker is perhaps more important. It is indeed, a low impedance value is not always an indication of a particularly reactive load. When the current is lagging or leading the voltage by more than a few 10's of degrees is where problems with increased power dissipation in the outputs will occur.
No one can ever say these forums are dull can they 😀
No one can ever say these forums are dull can they 😀
Unless there is much more definition of how they actually measured the impedance curve with the driven sine wave, the results are bogus.
The graph is misleading, as it implies the blue line measured impedance at those frequencies. From what I can see, the real measurement simply is a nominal or average impedance as seen by Vrms/Irms... of the complex square wave. As such, it is misleading to plot this as they did, as no discrete point is a measure of just one frequency. Each data point on the curve is in fact the "sampled" impedance curve at the harmonics of each square wave. Given the weighting of the harmonics and the 5kHz minimum, and the possibility of a critical mis-calc using 1Vrms for the 1V p-p square wave (1V p-p square wave is >1V rms), the result shown is not all that surprising.
Once again a good demonstration of how easy it is to take curious looking measurements, and how difficult it is to take meaningful ones. 🙄
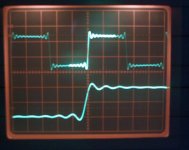
At the risk of going a bit off the original question I thought I had better back up my statement in post 10 that "A CD player can not even reproduce a 1 Khz squarewave" and that if this were an amplifier etc it would be deemed unnaceptable.
So if anyone is interested, this is a squarewave as reproduced by any CD player. It consists of 22samples high followed by 22 samples low. The lower trace is showing the slow risetime in more detail. The ringing is caused by the reconstuctive filtering within the player.
So if anyone is interested, this is a squarewave as reproduced by any CD player. It consists of 22samples high followed by 22 samples low. The lower trace is showing the slow risetime in more detail. The ringing is caused by the reconstuctive filtering within the player.
Attachments
sreten said:
Somebody move this to car audio (amplifiers) where it belongs .....
🙂/sreten.
before moving please answer to my question 🙂
best,
graaf
That "dynamic square wave" impedance really seems to be BS. They don't even give a definition.
OTOH, their test system (a voltage controlled current source) looks fine.
In a sense their blue curve looks similar to what Stereophile / Keith Howard has introduced as "EPDR = Equivalent Peak Dissipation Resistance", which isn't the speaker's impedance, instead it's the resistance vs. frequency which will give the same power dissipation as the speaker in an class AB power amplifier -- but still these are not the same voltage/current relationships the amp sees (regarding SOA issues). Maybe it's just this what they want to tell us with that graph.
Like Andrew, I've always used 3*Vrail/Rdc as the worst case transient current, which could theoretically appear at any output voltage -- an amplifier designed with that much SOA safety margin will do well with any speaker of that nominal impedance class (which is allowed only to be 20% higher that Rdc -- ie a 4Ohms speaker must not drop below 3.2Ohms)
- Klaus
Mark Seaton said:Unless there is much more definition of how they actually measured the impedance curve with the driven sine wave, the results are bogus.
The graph is misleading, as it implies the blue line measured impedance at those frequencies. From what I can see, the real measurement simply is a nominal or average impedance as seen by Vrms/Irms... of the complex square wave. As such, it is misleading to plot this as they did, as no discrete point is a measure of just one frequency. Each data point on the curve is in fact the "sampled" impedance curve at the harmonics of each square wave.
why do You think the graph is misleading?
what do You mean by saying that it is "sampled"?
to me what is shown seems to be impedance at a fundamental frequency in the presence of certain amount if its harmonics, technically summing up as a square wave
why the result of the measurement cannot be plotted the way they did it?
You say "no discrete point is a measure of just one frequency"
what do You mean by saying "just one frequency"
I understand that the "discrete points" are at the fundamentals of the square waves, aren’t they?
the fundamental is the "just one frequency", as You have put it, only the impedance at the frequency is measured in the presence of its harmonics
BTW I have seen also impedance measurements that used a sine wave in the presence of pink noise - there it would be impedance measured using sine wave of "just one frequency" in the discrete points of measurements in the presence of pink noise, wouldn’t it?
Is anything fundamentally wrong with such measurements?
Are their results somewhat misleading WRT voltage/current requirements of the loudspeaker under test?
Are they more misleading than typical measurement using a sine wave?
I am technical layman, just asking
best,
graaf
KSTR said:That "dynamic square wave" impedance really seems to be BS. They don't even give a definition.
I think they did
it is the impedance measured with sine wave of a certain frequency in the presence of certain amount of its harmonics, where the amount is summing up with the fundamental as a square wave
KSTR said:
but still these are not the same voltage/current relationships the amp sees (regarding SOA issues).
so, what are the relationships the amp sees?
what about Ohm's law?
and what are the "SOA issues"? 🙂
just layman asking 🙂
best,
graaf
Hi Graaf,
Your question on Safe Operating Area and Ohms law.
Low impedance loads and highly reactive loads are not one and the same. Imagine a Class B amp feeding a pure resistive load with a sine wave. As the output voltage rises during the first 90 degrees of the input cycle, the current in the load increases proportionally. Ohms law works, you can take the voltage at any given point in time and calculate the current flowing and also the power in the load at that instant. So far so good. The current through whichever output device is conducting also increases, but the voltage ACROSS the conducting device decreases as the output climbs toward the rail voltage. So we can plot a graph showing dissipation in the outputs, and derive a SOAR graph from this and the data for the output device used.
A reactive load is different. The voltage across the load and the current through it are not in phase. Ohms law in that sense does not work now because a simple measurement does not take this phase difference into account. The current may be lagging or leading the voltage depending on the load. So your output devices could now be under threat of failure. The current may perhaps be lagging and so it is possible to have a large current through the output device, while at the same time the voltage across the output device is also higher than you would expect it to be in the case of the resistive load.
A speaker is such a complex load, the impedance plot being only half the story. It's how reactive it is as well.
So what about the squarewave case. The minimum impedance points appear at the same frequencies ( as I tested and confirmed a few posts earlier ) but the max power drawn from the amp is higher, and the power in the load is higher because presumably it is also reproducing ( as power in the load ) the harmonics. All these harmonics will cause the voltage and current to have differing phase relationships.
In my opinion, ultimately square wave testing of a load like a speaker is not very meaningful, there is nothing like it in music, and ultimately that is what we are trying to reproduce. As I say, thats just a personal opinion.
Regards Karl
graaf said:
why do You think the graph is misleading?
what do You mean by saying that it is "sampled"?
to me what is shown seems to be impedance at a fundamental frequency in the presence of certain amount if its harmonics, technically summing up as a square wave
why the result of the measurement cannot be plotted the way they did it?
You say "no discrete point is a measure of just one frequency"
what do You mean by saying "just one frequency"
I understand that the "discrete points" are at the fundamentals of the square waves, aren’t they?
the fundamental is the "just one frequency", as You have put it, only the impedance at the frequency is measured in the presence of its harmonics
BTW I have seen also impedance measurements that used a sine wave in the presence of pink noise - there it would be impedance measured using sine wave of "just one frequency" in the discrete points of measurements in the presence of pink noise, wouldn’t it?
Is anything fundamentally wrong with such measurements?
Are their results somewhat misleading WRT voltage/current requirements of the loudspeaker under test?
Are they more misleading than typical measurement using a sine wave?
I am technical layman, just asking
best,
graaf
Hi graaf,
You seem to by inferring many details which are not specified in the text. It is not clear exactly what was measured nor how for any case other than the sine wave test.
The most important point I was making was that how the impedance is measured and calculated is not clear for a complex waveform such as a square wave. Remember a square wave contains many frequency components at different frequencies. You seem to believe they measured the impedance just related to the fundamental of the square wave. I do not believe this is the case, and the plots presented suggest this as well.
It is possible to calculate what we might call an average impedance for a complex signal, but the impedance at a specific frequency does not change in the presence of other frequencies unless the driver's parameters are being modulated from over excursion or too much power. Unless the driver is being significantly overdriven, the impedance at a given frequency will not change, and a square wave is just a specific case of multiple frequencies present at the same time.
This "square wave impedance" measurement does not strike me as meaningful in any way. Why don't they do a "pink noise impedance" as music is more like pink noise than a square wave...?
Testing of an amplifier into reactive loads is useful to see what it is made of, but I think this square wave impedance measurement is just a way to try to communicate what they are doing to people who don't understand the powercube capacitive inductive graphs.
Note that their "impedance measurement" rather looks like the impedance phase. Might be interesting for someone to calculate the "power factor" of the load and see how it correlates to their graph...
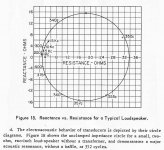
Here's another way of looking at things that time seems to have forgotten. This is from the GR Z-Y bridge manual mentioned earlier. One could plot the exact same thing with just a scope, sig gen and a resistor. Remember that negative reactance is capacitance and positive reactance is inductance. On the resistance axis the plot never goes negative, but this a just a simple 2" speaker. If you did the same plot for a multi-way system with a complex crossover, it might well hit all four quadrants and show several loops besides. Also note that the bulk of the circle is a narrow frequency range where resonance occurs. Most of the response is in the narrow area to the left.
Attachments
graaf said:
before moving please answer to my question 🙂
graaf
Hi,
You are taking a meaningless graph too seriously.
🙂/sreten.
sreten said:
Hi,
You are taking a meaningless graph too seriously.
🙂/sreten.
not at all 😀
well...
perhaps what I am taking too seriously is talking to people like You 😉
graaf said:Hi everybody!
I mean the following problem:
http://www.audiograph.se/subpages/technical/whatmakesagoodamplifier.htm
Can anybody explain this please? 🙂
Is it common that an amp "sees" an impedance 4 times less than the nominal impedance of the loudspeaker? Or can it be 2 times less or 2 times more and so on?
What are the deciding factors?
Is it a part of a larger and overlooked "amplifier-loudspeaker inteface" problem?
best,
graaf
A speakers impedance can vary greatly over its frequency range.
A speaker can be simplified into a resistance and an inductance in series. This means the impedance is the lowest resistance the amp can see.
The impedance can become quite high at resonance due to the mechanical efficiency being best at resonance.
Re: Re: "The Dynamical Loudspeaker Impedance"?
Or slightly less simply, as a resistance and inductance in series with an LCR (from Rod Elliots' site):
nigelwright7557 said:A speaker can be simplified into a resistance and an inductance in series. This means the impedance is the lowest resistance the amp can see.
The impedance can become quite high at resonance due to the mechanical efficiency being best at resonance.
Or slightly less simply, as a resistance and inductance in series with an LCR (from Rod Elliots' site):
An externally hosted image should be here but it was not working when we last tested it.
Re: Re: Re: "The Dynamical Loudspeaker Impedance"?
I cant see where the large capacitance comes from.
The voice coil is simply a coil of wire.
Cloth Ears said:
Or slightly less simply, as a resistance and inductance in series with an LCR (from Rod Elliots' site):
An externally hosted image should be here but it was not working when we last tested it.
I cant see where the large capacitance comes from.
The voice coil is simply a coil of wire.
Re: Re: Re: Re: "The Dynamical Loudspeaker Impedance"?
If that's all it was, then you'd be right.
But you need to electrically model the different bits of the driver when it's moving (as it's not a fixed system). The mass of the cone that's being moved (the large capacitance), the compliance of the same (the inductor), and the electrical resistance due to the suspension (the big resistor) are the major bits. And I'm pretty sure you have to take into account the air that's being moved as well, but I don't know how that fits in, which is why I used Rod's picture.
I'm not sure which driver those figures are for, though...
nigelwright7557 said:I cant see where the large capacitance comes from.
The voice coil is simply a coil of wire.
If that's all it was, then you'd be right.
But you need to electrically model the different bits of the driver when it's moving (as it's not a fixed system). The mass of the cone that's being moved (the large capacitance), the compliance of the same (the inductor), and the electrical resistance due to the suspension (the big resistor) are the major bits. And I'm pretty sure you have to take into account the air that's being moved as well, but I don't know how that fits in, which is why I used Rod's picture.
I'm not sure which driver those figures are for, though...
Re: Re: Re: Re: Re: "The Dynamical Loudspeaker Impedance"?
I suppose a speaker is quite complex because it is a coil creating a magnetic field inside another magnetic field.
Cloth Ears said:
If that's all it was, then you'd be right.
But you need to electrically model the different bits of the driver when it's moving (as it's not a fixed system). The mass of the cone that's being moved (the large capacitance), the compliance of the same (the inductor), and the electrical resistance due to the suspension (the big resistor) are the major bits. And I'm pretty sure you have to take into account the air that's being moved as well, but I don't know how that fits in, which is why I used Rod's picture.
I'm not sure which driver those figures are for, though...
I suppose a speaker is quite complex because it is a coil creating a magnetic field inside another magnetic field.
- Status
- Not open for further replies.
- Home
- Loudspeakers
- Multi-Way
- "The Dynamical Loudspeaker Impedance"?