You guys mean SF6 - Sulfur Hexaflouride, right? The tetraflouride is not something you want to use I think.
It may end up being banned at some point, even in power electronics, since it's one of if not the most potent greenhouse gas we know of. Not a problem for small scale use of course.
SF6 is very good with HV circuits.
-RNm
Complex numbers (in polar form, amplitude AND phase) are made up of Sines AND Cosines ...As I recall, using only the real component of an FFT analysis does not describe a unique time domain waveform.
Perhaps someone else can elaborate.
jn
Looking at this at "full resolution" (it's about three times the height of my browser window), upper left is "standard textbook" DSP notation of each sample point extending up or down from the x axis. I zoomed in on a waveform in Audacity and saw this as the representation. Perhaps there's a setting to change it, but I didn't investigate.Jn, Hans showed us the waveforms as they are represented in typical audio editing application.
There is no provision of overlaying graphical representation of waveforms of different audio files in audio (read = music) editors, that we, mortals use. It is up to you, research people, to fire up your Matlabs, Pythons or what have you, to plot graphs, do overlays and show them to us to prove your point. This is what, I think, Hans was hinting at.
I don't know if you realize it, but graphical waveform representation in audio editing applications are there for user's convenience. They are not ment to be used as measurement tool, as each application has its own way of drawing those waveforms. They do differ from application to application and may even look differently at various zoom levels. How the waveform is drawn between the discrete sample points and how the line is interpolated in graphics department is only known to person who coded the application.
Drawing conclusions about the zero crossings from such representations, in my opinion, makes no sense.
Below is screenshot of our beloved 20kHz raised cosine burst sampled at 88.2kHz loaded in five different audio editors. Now, which one is "the right one" and what can one do with this information? 😉
The lower left shows the sample dots with the curved line through them that appears to be (it's hard to be sure offhand) the output of a (near-)brickwall low-pass filter at half the sample rate. My Cool Edit 2000 (which shortly after became Adobe Audition) draws such a curved line. This is what I would think of as "correct" - it (minus the dots) is presumably what would (or should) come out of a DAC and reconstruction filter.
The others are variations of drawing straight lines between sample points, and give crude representations of the waveshape. I've seen writings actually WARN AGAINST thinking of digital signals this way.
Last edited:
I agree with all you say. That said, his displays are within a common window, the time marks are every 5 uSec. And the data is quantized well below that time frame. It is not an issue of presentation.Jn, Hans showed us the waveforms as they are represented in typical audio editing application.
There is no provision of overlaying graphical representation of waveforms of different audio files in audio (read = music) editors, that we, mortals use. It is up to you, research people, to fire up your Matlabs, Pythons or what have you, to plot graphs, do overlays and show them to us to prove your point. This is what, I think, Hans was hinting at.
I don't know if you realize it, but graphical waveform representation in audio editing applications are there for user's convenience. They are not ment to be used as measurement tool, as each application has its own way of drawing those waveforms. They do differ from application to application and may even look differently at various zoom levels. How the waveform is drawn between the discrete sample points and how the line is interpolated in graphics department is only known to person who coded the application.
Drawing conclusions about the zero crossings from such representations, in my opinion, makes no sense.
Below is screenshot of our beloved 20kHz raised cosine burst sampled at 88.2kHz loaded in five different audio editors. Now, which one is "the right one" and what can one do with this information? 😉
I would be the first to question the consistency of data. He has presented very good data.
I have pointed out that given the exact same format, with a consistently good fidelity, the frequency as determined by zero crossings is different between what went into the filter, and what came out. In engineering school, they never taught us to ignore obvious time domain differences and pretend they were identical.
We are spending a significant amount of time ignoring the obvious, shouldn't we be discussing why the output is not consistent with what we were taught?
In point of fact, we were never taught about what happens when a signal comprised of two sidebands, carrier or not, is put into a filter such that the upper sideband is eliminated, and what to expect as an output in the time domain.
I have learned in the intervening time, that unexpected results should not be ignored.
My forte is not intelligence, but observational skills. When two waveforms are significantly different, they are indeed DIFFERENT..
No amount of verbage can alter that fact.
I have presented an accurate description of a trig identity, modulation sidebands, the consequence of eliminating the upper sideband, and far more importantly, I have provided a specific predictor of outcome that can easily be tested.
With a 20/4 input to a filter that removes the USB, the output is 18/2.
The most important part of a hypothesis is prediction and testability. Don't you agree?
Jn
Ps... Mountain Bob...I take back all the really nasty things I ever said about you...your post on how to work the iPad was perfect!!!!
Well, ok I never said anything bad about you...but if I had, I would take it back..😀
Last edited:
Yes, assuming the frequencies, amplitudes and phases don't change within the sampled window over which the transformation is done.Fourier analysis formulae provide answers for both phase and frequency of harmonics.
Be careful - I jokingly said something similar to that (maybe in the last year in some, ahem, "flamethrower" thread), and I was told I needed to learn DSP.The problem that I see, although it is more like a paradox, in reality, there are no continually repetitive signals like sines, square waves and anything with a fixed waveform. These simply do not exist. A periodic function continues indefinitely until t=∞, which is another way of saying it never stops. If a repetitive waveform stops its behaviour is like a complex pulse.
You guys mean SF6 - Sulfur Hexaflouride, right?
Yes. He got the suffix wrong, but i got the link right.
dave
To further stir the pot..
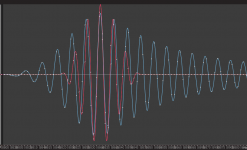
I ran the same 20kHz raised cosine burst sampled at 88.2kHz thru two different "minimum phase" filters I mentioned several posts back set at 20.1kHz. I wanted to see what is different compared to textbook brickwall filter.
Screenshots are overlaid in Photoshop. Original and filtered signals are aligned on highest peaks so that their zero crossings coincide. The audio editing application uses 33rd order waveform interpolation for display, whatever that means.
Honestly, I do not understand what I'm seeing. Yes, all other zero crossings do not coincide, but, what's more interesting, the amount of "offset" (if one may call it so) from the center peak in both directions is different for both filters.
Jn, what is it? How do you interpret the results?
P.S. If you want me to align waveforms on some other points, just let me know, I saved the PSD files.
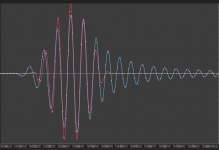
Attachments
Last edited:
It is so quiet here at the moment, so I'd like to use the opportunity and thank the Moderation Team for the measures they've taken. Well done! It was long overdue. The S/N ratio of this thread have improved significantly, at least for the moment.
At one point in the old thread I was regulary seeing 2/3 of the page filled with posts by those from my ignore list. At first I thought that there's something not quite right with this one until I realized that all the rubbish is gone 🙂.
Please, keep it that way.
Thank you!
At one point in the old thread I was regulary seeing 2/3 of the page filled with posts by those from my ignore list. At first I thought that there's something not quite right with this one until I realized that all the rubbish is gone 🙂.
Please, keep it that way.
Thank you!
As I recall, using only the real component of an FFT analysis does not describe a unique time domain waveform.
Perhaps someone else can elaborate.
jn
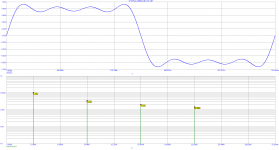
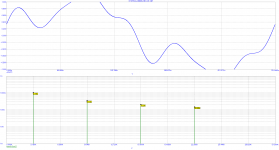
You are right. My favourite plots showing this is a sum of sine waves with same spectra - the only difference is a phase of sine waves. This results in totally different time waves. Same amplitude spectra, different time plots - because phase info is missing.
Attachments
Dayton-Wright. He also used it in the bass enclosures of his later conventional speakers to reduce the box size needed.
dave
I don't see how this could work for a sealed enclosure. It is the spring constant of the gas inside the enclosure that is relevant here. This is the same for all gasses; molecular weight does not come into play.
In the case of a bass reflex enclosure, that is different of course. Here, it is the weight of the gas in the vent that acts as the mass that works against the gas spring inside the enclosure. A heavier gas would allow for a shorter vent with a smaller diameter. However, it would be impossible to contain the gas, so no cigar.
You are right. My favourite plots showing this is a sum of sine waves with same spectra - the only difference is a phase of sine waves. This results in totally different time waves. Same amplitude spectra, different time plots - because phase info is missing.
I'm presuming John knows that? Take a "blip" pass it through a filter and the differing phase shifts create a waveform that appears to have shifted in frequency.
Are we talking about Group Delay affects of a sharp cut-off LPF at 22khz?
Group delay in a filter is the time delay of the signal through the device under test as a function of frequency. If we take the example of a modulated sine wave, for example an AM radio signal. Group delay is a measurement of the time taken by the modulated signal to get through the system.
THx-RNMarsh
You are right. My favourite plots showing this is a sum of sine waves with same spectra - the only difference is a phase of sine waves. This results in totally different time waves. Same amplitude spectra, different time plots - because phase info is missing.
JN referred to the Real component of an FFT.
In your example they will differ completely.
However the moduli of Re and Im, the amplitude spectra as you mention, will be the same.
Hans
And yes, in the case where the brickwall filter removes the upper sideband, the waveforms will certainly change. But not the frequency. As far as I can see, removing an inaudible upper sideband would probably make no difference to audibility. The human perception system would remove it even if it was still there.
Hans - do you have your before and after brickwall waveforms as wav files or anything like that?
Hans - do you have your before and after brickwall waveforms as wav files or anything like that?
And yes, in the case where the brickwall filter removes the upper sideband, the waveforms will certainly change. But not the frequency. As far as I can see, removing an inaudible upper sideband would probably make no difference to audibility. The human perception system would remove it even if it was still there.
Hans - do you have your before and after brickwall waveforms as wav files or anything like that?
No problem, tell me what you want and I will produce a few for you, because I haven't saved any of the .wav files.
Hans
I don't know how you could make anything potentially audible. A blip that would correspond to the waveforms shown would be too short in duration.
I don't see how this could work for a sealed enclosure. It is the spring constant of the gas inside the enclosure that is relevant here. This is the same for all gasses; molecular weight does not come into play.
In the case of a bass reflex enclosure, that is different of course. Here, it is the weight of the gas in the vent that acts as the mass that works against the gas spring inside the enclosure. A heavier gas would allow for a shorter vent with a smaller diameter. However, it would be impossible to contain the gas, so no cigar.
The speed of sound changes, so the effective enclosure size changes.
Jn
Very nice. I've no idea how to interpret the different filters.To further stir the pot..
I ran the same 20kHz raised cosine burst sampled at 88.2kHz thru two different "minimum phase" filters I mentioned several posts back set at 20.1kHz. I wanted to see what is different compared to textbook brickwall filter.
Screenshots are overlaid in Photoshop. Original and filtered signals are aligned on highest peaks so that their zero crossings coincide. The audio editing application uses 33rd order waveform interpolation for display, whatever that means.
Honestly, I do not understand what I'm seeing. Yes, all other zero crossings do not coincide, but, what's more interesting, the amount of "offset" (if one may call it so) from the center peak in both directions is different for both filters.
Jn, what is it? How do you interpret the results?
P.S. If you want me to align waveforms on some other points, just let me know, I saved the PSD files.
Jn
Coming back to the high pressure water, I once watched a steel deck being de-rusted with an 8,000 psi capable jetting lance.
The person holding the lance was over 100Kg and was cleaning the steel to bright clean at about 5,000 psi, his buddy on the pump briefly raised the pressure and lifted him off the floor for a second than lowered the pressure to normal.
So it could certainly penetrate the skin, but unlike oil, the water would disperse into the blood and be elimiated by the kidneys. I would still be a little bit concerned about the debris, but that could be slowly dealt with by the body.
The big issue is that oil has no means to be absorbed and removed when it is dispersed under the skin, and it causes the tissue nearby to die from lack of oxygen and nutrients.
Leather should stop a small pin hole, but a larger leak would pentrate even leather.
I once hired a 3,000 psi jetting pump to strip render off a house, at 2,500 it would cut into the bricks when taken too close...
Last edited:
Guys, the exercise of examination of cos modulated sines is just a prelude to the actual understanding. The purpose of looking at two sines with the identity, or even raised sine modulation is to show the real point.
Modulation of a carrier produces sidebands, and removal of one of the sidebands will change the signal both by frequency and by amplitude. Frequency by the variation of the phase walking (part of the beat frequency aspect), and amplitude as one element of the beat is being reduced or dropped.
A cymbal has both in-audio-band components being amplitude modulated, and above band components being amplitude modulated. So there are two categories of signal to worry about...modulated audible signals which have sidebands above Fs, and ultrasonic signals with lower sidebands below Fs which are audible.
Removing everything above Fs alters freq and envelope for signals with sidebands above Fs, and removes modulated ultrasonics which have sidebands we can hear.
That is why I recommend 40khz as a limit. that completely stops the possibility of altering the signal by truncation of sidebands. I in no way believe we can hear actual frequencies above 20k however.
Jn
Last edited:
I mentioned it to point out one needs both components to reconstruct a unique waveform.JN referred to the Real component of an FFT.
In your example they will differ completely.
However the moduli of Re and Im, the amplitude spectra as you mention, will be the same.
Hans
Jn
- Home
- Member Areas
- The Lounge
- The Black Hole......