Yep. Composite amplifiers work well. 🙂 It'll be interesting to see how well the sims hold up to reality. Stability is definitely a challenge in composite amps. I recommend simulating with 8 ohm in parallel with increasing capacitance. I usually go up to 1-5 uF.
Tom
Hi Tom,
Regarding your valid remark about sim vs reality, in posting #4 there is a real life recoding of IMD and THD.
May be with a bit of explanation:
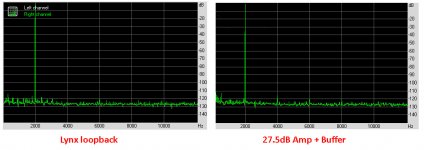
I started with a loopback of my Lynx sound processor as a reference for my later measurement, see both in the image below.
Noise in both cases is at the same level, so Lynx is dominant for the visible noise.
The small peak at 4Khz however is not in the Lynx spectrum an must therefore be produced by my amplifier.
However to measure the nested buffer, I needed to insert the complementary 27.5dB amplifier to to get the desired output level.
Since I did not measure this amp in isolation, I can't tell whether the amp or the buffer was producing this H2.
But because being in the ppm level, I was satisfied in my expectations and paid no further notice.
The most complex version 4 can be loaded with any cap up to 5uH//8R without a problem.
However I would never rely on LTSpice with the risk of later burning an expensive speaker, so my advise is to always test this in real life.
As a side remark, my experience is that cap values of between 10nF and 100nF are more critical than caps above 1uF.
Hans
Attachments
Hayk,
Thanks for these figures.
Not that bad, isn't it and in fact more of an intellectual challenge than anything else.
Yours only differ slightly from the figures with my .four, but both outcomes are way below the 618nV noise from 20Hz to 20Khz.
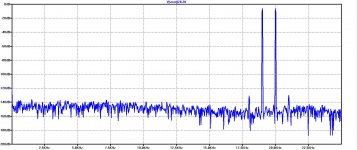
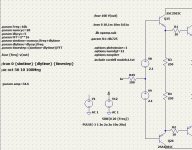
What I regularly do is to add a white noise source to the models input, giving a FFT result that is more conform to reality.
See for instance a simulated IMD spectrum with added white noise.
Hans
Thanks for these figures.
Not that bad, isn't it and in fact more of an intellectual challenge than anything else.
Yours only differ slightly from the figures with my .four, but both outcomes are way below the 618nV noise from 20Hz to 20Khz.
What I regularly do is to add a white noise source to the models input, giving a FFT result that is more conform to reality.
See for instance a simulated IMD spectrum with added white noise.
Hans
Attachments
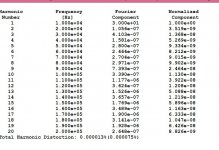
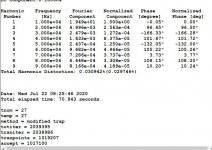
For 10khz 30V
Hayk,
You did not specify the load in your data.
But why are you taking 20 harmonic components from a 10Khz signal.
That goes up to 200kHz.
I just took 10, and that's already more than enough to my feeling, also because in THD measurements often a 80Khz BW is being used.
Anyhow, there is hardly any difference between yours and mine H1 to H10.
So I have the feeling you are trying to tell something, but I don't get the message, maybe you could explain.
Hans
Last edited:
Do you have a noise file or some zener diode generating?
Use an Arbitrary Behavioral Voltage source, and instruct:
V={Amplitude}*White({FR}*Time)
Where .param {FR} should be BW*6.28.
{Amplitude} speaks for itself.
This will give you a white noise spectrum with specified BW.
Hans
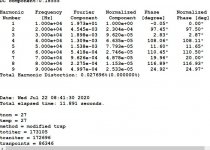
May be you did not notice post 20, The 1khz 40v loaded 4 ohms R51, gives 0.000000%, I wanted to see with same measurements what I get at 10khz 30V.
With adjustments necessary for high precision FFT, the fourier analysis, gives 10 times less distortion numbers than it should , in my thread about the subject. By these measurements, if readers can have doubts about your measurements, with mine totally different way, can clear all skepticism.
What do you mean "specify the load in Data", R51 you have it fixed 4.
Thanks about the noise tip, I must have lot to learn.
Last edited:
Thank you for mentioning this.
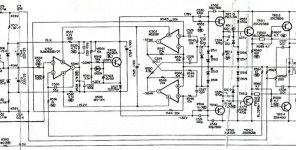
Do you happen to have more details like a circuit diagram ?
Would be interesting to see what they did.
Hans
You can download service manual from POA-6600 in the web.
POA-6600A uses a different approach.
The more advanced device in this line is POA-8000 that is still expensive even with 30 years old.
Those files are big to add in the thread sorry.
May be you did not notice post 20, The 1khz 40v loaded 4 ohms R51, gives 0.000000%, I wanted to see with same measurements what I get at 10khz 30V.
With adjustments necessary for high precision FFT, the fourier analysis, gives 10 times less distortion numbers than it should , in my thread about the subject. By these measurements, if readers can have doubts about your measurements, with mine totally different way, can clear all skepticism.
What do you mean "specify the load in Data", R51 you have it fixed 4.
Thanks about the noise tip, I must have lot to learn.
Yes of course, I did notice post#20, but it does not mention the value of R51, but I understand that you used the 4R that was in the model, a value that I constantly changed between 4R and 8R for the images that I made.
The shape of an FFT is depending on many factors, but in this case you and I are just looking at the outcome of the .four command.
I don't see why there should be a discussion whether 1 cycle or 20 complete cycles are used for the .four execution. Both our methods are the same and not at all totally different.
The only parameter that influences accuracy is the sampling rate, or the number of points.
This is the .param FFT in my model. I mostly use 2**16, and eventually a higher value like 2**18 to check whether 2**16 was sufficiently accurate.
In your case 10.000 points/cycle and in my case 2**16 for 20 cycles giving 3276 points/cycle and with the higher 2**18 even 13107/cycle.
It's therefore no surprise that our results match within ca. 10%.
However the name of this .param FFT is misleading because it has nothing to do with an FFT but only with the number of samples.
Hans
Denon POA6600
Thank you for the Denon model.
I will have a look at it and try to understand.
Hans
Really interesting stuff. How does the output noise change (if at all) between these different versions?
Noise depends completely on the used op-amps.
In case of the components used, noise from 20Hz to 20Khz is resp:
Version 2: 1617nV
Version 3: 866nV
Version 3a: 866nV
Version 4: 618nV
Hans
In case of the components used, noise from 20Hz to 20Khz is resp:
Version 2: 1617nV
Version 3: 866nV
Version 3a: 866nV
Version 4: 618nV
Hans
If you did notice post 28, for 20w 10khz 4 ohms, you measure 1×10-⁷ and I, 1×10-⁶, The LT also gives another number in parenthesis 0.000073, what is it, THD+N?
With my test for FFT, 100 cycles sampled by 1000 points/cycle gives very precise measurements.
With my test for FFT, 100 cycles sampled by 1000 points/cycle gives very precise measurements.
Last edited:
How does that equate to the voltage a speaker would see, e.g. with inputs shorted? Even a very good amp would usually have total noise > 20-40 uV.Noise depends completely on the used op-amps.
In case of the components used, noise from 20Hz to 20Khz is resp:
Version 2: 1617nV
Version 3: 866nV
Version 3a: 866nV
Version 4: 618nV
Hans
This is measured with version1 at 50W 10k 4 ohm, because in your graphic it is exactly 3×10-⁴. with my measurement it is 3×10-²%.
Sorry, in my precedent post I was wrong, we both measure the same number, I was confused as your graphics are not percentage.
Attachments
Last edited:
Something tells me that THD is not included in the opamp models. Did you check?
Tom
Hi Tom,
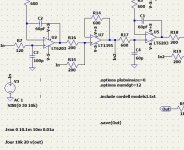
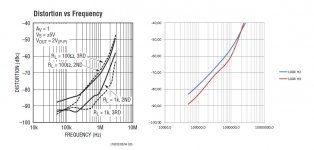
This is quite easy to check against the Specs.
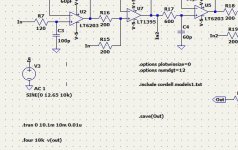
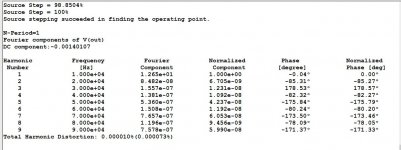
So I did this test for 100R for the LT6203 the dominant op-amp in Version 4, see image below.
The values are amazingly close to their specs.
So all in all, I would say, yes op-amp distortions are included, but for such a complex component, there will always be a discrepancy.
That's why I added the real life measurement in #4, and remember, that measurement even included a 27.5dB amp.
Hans
Attachments
Hayk,
With all respect, but can we please stop with this .four discussion.
I don't think it leads to a useful conclusion.
Most important seems to me that when comparing THD figures, that they are made with the same methodology.
I have made a number of 10Khz sims with Version1 at 50Watt@4R as you did, with the folowing results:
1 cycle 1e4 points THD = 0.039%
1 cycle 1e5 points THD = 0.031%
20 cycles 2e16 points THD = 0.031%|
20 cycles 2e18 points THD = 0.031%
100Cycles 1e4 points THD = 0,044%
100 Cycles 1e5 points THD = 0.033%
100 cycles 1e6 points THD = 0.031%
100 cycles 2e18 points THD = 0.031%
1000 Cycles 1e4 points THD = 0,238%
So my conclusion is that 1 cycle is O.K. with 1e5 points or more, 20 cycles with 2e16 and 100 cycles with 1e6 points as well.
So I will stick to the 20 cycles with 2e16 or more points.
Hans
- Home
- Amplifiers
- Solid State
- THD going down from 100ppm to 1/100 ppm in 4 versions of a 100W@8R / 200W@4R buffer