The only way that I am aware of, is to look at the predicted response for the system in question.
So, we need to repeat what you indicated on the post #173, simulating 1cab vs Many and visual check the upper low frequency limits, right?
i see the same dip in the sim as the FT30,witch is absent in realety.
i'm curius why that is.
i'm curius why that is.
An externally hosted image should be here but it was not working when we last tested it.
Attachments
i see the same dip in the sim as the FT30,witch is absent in realety.
i'm curius why that is.
Yes, I could try to guess that a brand new driver maybe give some influence, and to remove this doubt I should remake the measurements after some long run use. 😕
So, we need to repeat what you indicated on the post #173, simulating 1cab vs Many and visual check the upper low frequency limits, right?
The result is below, I used the same variants for 130dB SPL (Post #162 - table inside image) and looks like the lower frequency upper limit for SS15MOD+HPX2150 is ~141Hz, probably would be better to keep Xover under this value (lazy set up 😀 )
Attachments

So, we need to repeat what you indicated on the post #173, simulating 1cab vs Many and visual check the upper low frequency limits, right?
Hi LORDSANSUI,
I am not sure what you mean by "check the upper low frequency limits".
The reason for my Post #173 was simply to confirm that Hornresp did indeed produce the results indicated by weltersys, not the ones shown by you 🙂. I just wanted to avoid the possibility of any confusion. In most cases, it is more meaningful to evaluate the performance of a system using a constant input voltage rather than a constant input power.
It is not clear to me what it is exactly, that you are trying to achieve.
Kind regards,
David
I am not sure what you mean by "check the upper low frequency limits".
References are at posts #176 and # 177
Also after you mention the subject with a graphic with different curves if got my attention to find for difference behavior. At your graphics the differencs start from ~130Hz
The reason for my Post #173 was simply to confirm that Hornresp did indeed produce the results indicated by weltersys, not the ones shown by you 🙂. I just wanted to avoid the possibility of any confusion.
It's ok, english isn't my main language so sometimes misunderstand can happen and probably caused by me

At post #162 there are some simulations results and it's easy to check reading the columns that when you double the power input the output SPL will increase 3dB, but while doubling cabs the result was little different for some reason. You can double check the table if it's needed.
What weltersys suggests at post #165 should be right, and I was expecting the same, but wasn't the case, see the attachment #1 the results didn't provided the same output SPL while at the attachment #2 I achieve the same output SPL with different power ratio.
weltersys ratios:
.
1 cab = 1000 Watts/cab = 1000 Watts total Power ratio=8
2 cab = 250 Watts/cab = 500 Watts total Power ratio=4
4 cab = 62.5 Watts/cab = 250 Watts total Power ratio=2
8 cab = 15.625 Watts/cab = 125 Watts total (reference)
The ratio I was able to achieve the same output SPL (130 dB)
.
1 cab = 750 Watts/cab = 750 Watts total Power ratio=4,26
2 cab = 200 Watts/cab = 400 Watts total Power ratio=2,27
4 cab = 64 Watts/cab = 256 Watts total Power ratio=1,56
8 cab = 22 Watts/cab = 176 Watts total (reference)
It is not clear to me what it is exactly, that you are trying to achieve
I was playing around with multi cabs to better understand the effects so I came with the idea to plot the graphic on post #163 to make the result more friendly for others.
Attachments

Hi LORDSANSUI,
Many thanks for the additional information, it appears that we were perhaps talking at cross purposes 🙂.
As indicated in the last sentence of his post, weltersys is referring to the performance that can be expected in the frequency range where the outputs from the multiple cabinets are effectively acting as one large acoustic source. This is the point that I tried to highlight in my example, which showed the effect only lasting to just above 100 Hz (for that particular case). It seems that you are referring instead to the performance above this frequency, which will be as you have shown, assuming constant input power.
Sorry for any confusion caused 🙂.
Kind regards
David
It seems that you are referring instead to the performance above this frequency, which will be as you have shown, assuming constant input power.
hi David, may I clear one more thing?
It's stranger when you refer to "assuming constant input power" when the simulation I done I think was "assuming constant input voltage".
That's new! The last time I checked, Eg was the amplifier open-circuit rms output voltage 🙂.
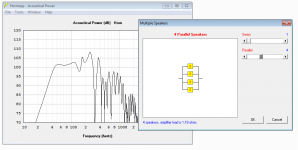
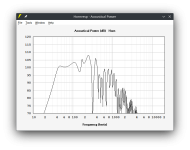
At hornresp input screen, when we double click at Eg the input data is Power in watts and impedance in ohm but when we press OK the software will change the values entered to a constant correlated voltage and I think this is confirmed by attached image. It was generated running the simulation again with 1 cab @ 750W than at 4 Acoustical Power screen I went to Tools followed by Driver Power. The graphic clear shows that the power is not constant 😛 I made the math for some point and it's right so it confirm that the simulation was done assuming constant input voltage.
is there any misunderstanding here?
Attachments

is there any misunderstanding here?
Hi LORDSANSUI,
Because you were quoting power figures I assumed that you were using the Maximum SPL tool to specify amplifier output power, resulting in a constant input power 🙂.
1 cab = 750 Watts/cab = 750 Watts total
2 cab = 200 Watts/cab = 400 Watts total
4 cab = 64 Watts/cab = 256 Watts total
8 cab = 22 Watts/cab = 176 Watts total
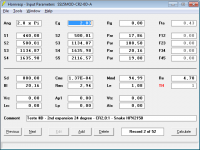
Q1. Would it be possible to post a screenprint of the input parameters window for your test example?
Q2. What value are you using for the "load impedance in ohms" when calculating the input voltage Eg required for a given power?
Q3. Are the multiple cabinets connected in series, parallel, or series/parallel?
Kind regards,
David
Hi David,
below the informations
See attachement #1
8 ohms
All variations were simulated in parallel using the Tool "Multiple speakers..." at acoustical power screen. See attached # 2 as example for 4 cabs.
.
below the informations
Q1. Would it be possible to post a screenprint of the input parameters window for your test example?
See attachement #1
Q2. What value are you using for the "load impedance in ohms" when calculating the input voltage Eg required for a given power?
8 ohms
Q3. Are the multiple cabinets connected in series, parallel, or series/parallel?
David
All variations were simulated in parallel using the Tool "Multiple speakers..." at acoustical power screen. See attached # 2 as example for 4 cabs.
.
Attachments
below the informations
Hi LORDSANSUI,
Thanks for the additional information.
I will investigate further, and let you know what I find.
Kind regards,
David
weltersys ratios:
1 cab = 1000 Watts/cab = 1000 Watts total Power ratio=8
2 cab = 250 Watts/cab = 500 Watts total Power ratio=4
4 cab = 62.5 Watts/cab = 250 Watts total Power ratio=2
8 cab = 15.625 Watts/cab = 125 Watts total (reference)
The ratio I was able to achieve the same output SPL (130 dB)
1 cab = 750 Watts/cab = 750 Watts total Power ratio=4,26
2 cab = 200 Watts/cab = 400 Watts total Power ratio=2,27
4 cab = 64 Watts/cab = 256 Watts total Power ratio=1,56
8 cab = 22 Watts/cab = 176 Watts total (reference)
Hi LORDSANSUI,
I have checked the Hornresp multiple speakers model and everything appears to be in order. The weltersys 1 cabinet versus 8 cabinets total power ratio of 8 assumes that the drivers in the multiple cabinets act as one large "composite" driver. This idealised model only applies at low frequencies. Your calculated total power ratio of 4.26 is applicable at some higher frequency, where the composite driver model no longer holds true.
Sanity check of weltersys ratios using your tapped horn test example:
1. Set frequency range to 1 - 2000 Hz
2. Set Eg = 89.44 volts (1000 watts into 8 ohms)
3. Sample acoustical power response at 0.1 Hz
Total electrical input power = 1701.9230 watts
Sound pressure level = -79.3340 dB
4. Set Eg = 11.18 volts (15.625 watts into 8 ohms)
5. Sample acoustical power response for 8 speakers in parallel at 0.1 Hz
Total electrical input power = 212.7404 watts
Sound pressure level = -79.3340 dB
Total electrical input power ratio = 1701.9230 / 212.7404 = 8.0000
Kind regards,
David
acoustical power response at 0.1 Hz
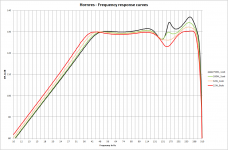
Hi David, thanks again to help, but looks like we reach to the point that the Math are not helping real life. What I mean, this design is planned to be used at the bandwidth starting from 36Hz till 130Hz as indicated in the attachment #1 by the blue bars, so in that bandwidth we can see that the response from 1cab (Eg=89,44) are not aligned with 8 cabs (Eg=11,18 - parallel).
In additional, you made the math at 0,1Hz 😱 😀 considering that human being can rear just over 20Hz, the result is no useful, the curves are overlapped almost till 15Hz, still not useful.
Based in the passband, while doubling the input voltage the SPL increases 3dB the same don't happen when doubling cabs.
Attachments
unfortunately that happens while using free servers.
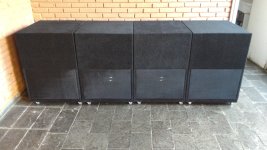
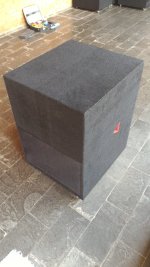
I will try to update at least the first post with the final version attaching photos at DIY server
I will try to update at least the first post with the final version attaching photos at DIY server

Yes share please LordI will try to update at least the first post with the final version attaching photos at DIY server
Yes share please Lord
Find attached all the information I think remains useful.
Hornresp Input
Hornresp SPL
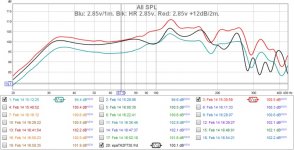
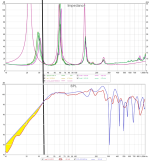
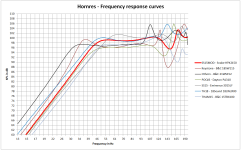
Benchmark (SPL)
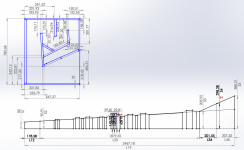
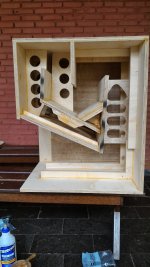
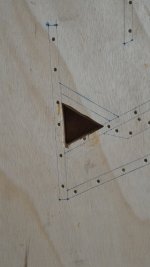
Sketch
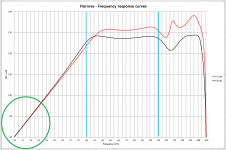
Measurements vs Simulation
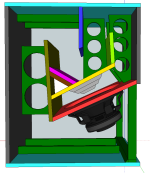
Bracing
Hornresp txt file
3D from Google Scketchup
3D from Freecad
This model fits better for drivers with intermediate motor force and it was tuned to as flat as possible in this case.
In the benchmark you can see that in the upper range some designs shows peaks as spike, mine show a small dip witch I think is better for integrate it with tops. In the measurement the dip was also smooth due to cone correction improving even more the output SPL.
Attachments
-
 Comparison-Z-SPL.png80.9 KB · Views: 50
 -
TH-SS1.zip279.3 KB · Views: 24
-
 SS15MOD_Final_18mm_Bracers.png17.2 KB · Views: 52
 -
 SS15MOD_Final_18mm_Plan.png79.8 KB · Views: 56
 -
 Benchmark.png47.5 KB · Views: 58
 -
Sansui_15_SS15MOD-18mm.zip853.7 KB · Views: 36
-
SS15mod.txt2.7 KB · Views: 26
-
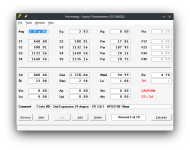 TH15mod - Inputs.png17.5 KB · Views: 50
 -
 TH15mod - SPL.png16 KB · Views: 50
Nice!! thanks for sharing Lord
did you still have those ?
i just got 4 brazilian PRV's 15SW2000-8's
for a project that have not started yet because lack
of free time from my local woodworker friend
did you still have those ?
i just got 4 brazilian PRV's 15SW2000-8's
for a project that have not started yet because lack
of free time from my local woodworker friend
Yes, I do, 2 of them still without driver after 7 years, other priorities in life but, someday, sometime, somehow I will buy another 2 and also will renew my top 10" moving away from BR to FLH
- Home
- Loudspeakers
- Subwoofers
- TH 15" flat response to 35Hz (-3dB) - By LORDSANSUI