After many years of doing it the hard (manual) way (Excel spreadsheet, millivoltmeter, oscillator and pencil!) I have decided to delve into measurement using a PC.
I wrote a little program to capture measurements from my PicoScope (still under development) but at the same time I was wanting something that would use a sound card (I have a 1/3 Octave TrueRTA licence).
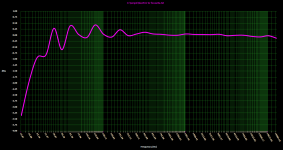
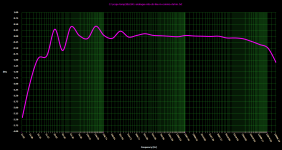
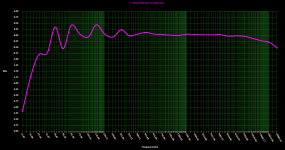
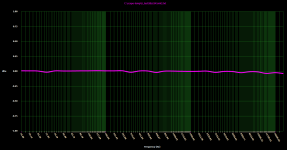
So after some experimenting, I have come up with the following graphs, and I am a bit confused as to why the bottom end is so lumpy (only by 0.2... 0.5dB or so).
I have access to a FocusRite Scarlett 2i2, a Sound Blaster (old!) 24bit Live external (SB0490), and a Tapco Link.Firewire 4x6.
You'll see form the graphs that all three sound 'card' devices yield the same lumpy bottom end, but measurements made using the scope are pretty much flat.
Why is this?
I wrote a little program to capture measurements from my PicoScope (still under development) but at the same time I was wanting something that would use a sound card (I have a 1/3 Octave TrueRTA licence).
So after some experimenting, I have come up with the following graphs, and I am a bit confused as to why the bottom end is so lumpy (only by 0.2... 0.5dB or so).
I have access to a FocusRite Scarlett 2i2, a Sound Blaster (old!) 24bit Live external (SB0490), and a Tapco Link.Firewire 4x6.
You'll see form the graphs that all three sound 'card' devices yield the same lumpy bottom end, but measurements made using the scope are pretty much flat.
Why is this?
Attachments
What are you measuring? What is causing the LF rolloff? What, if anything, are you doing about a windowing function? Wiggles in the frequency domain are usually the result of a sharp cliff in the time domain (and vice versa).
whoosh!!! As a lot of that passes right over my head!!!
These are simply measurements, purely to establish frequency resonse (only point of interest at this time).
I am not (knowingly!!) using a 'windowing function'* - I am simply feeding the output (terminated with 100k resistors) of the device under test straight into the 'line in' on the respective sound card.
I am then sending a sweep using WaveGene via SPDIF out to a DAC (just currently using a DAC as this has a known response).
Tests on the output of the sound cards reveal that they are practically flat.
So it's just this mysterious uneven LF response that's puzzling me when going via the sound card ADC. I wondered if it was some kind of LF non linearity or something? I did also wonder if it was some kind of weird issue with 50hz mains interference.
*goes off to Google windowing function.
Sorry, I thought you meant that you had written some FFT software. Something is doing an FFT, as you have shown four spectrums. Are you measuring white noise? A lot more detail is needed before we can say anything useful.
I'm doing the following:
1) Send a 16Hz to 22050Hz sweep at -1dB to the SPDIF input of a DAC.
2) Said DAC is connected to the input of a sound card.
3) The output from the sound card is read by TrueRTA on my PC, to give me a 1/3 Octave FFT sweep.
4) I export this sweep data to a comma delimited text file.
5) The graphs you see are generated by reading said text file.
I have also generated data manually, using an Oscilloscope, audio oscillator and an audio millivoltmeter, and reading RMS voltages at specific 'spot' frequencies of (16, 10, 25, 31.5, 40, 50, 63.5, 80, 100, 125, 160, 200, 250, 315, 400, 500, 630.5, 800, 1000, 1250, 1600, 2000, 2500, 3150, 4000, 5000, 6350, 8000, 10000, 12500, 16000, 22050 [Hz]).
I then plot each RMS voltage at the given frequency, (either using Excel, GnuPlot or my own program) and I get consistent results, without the LF 'wobble' seen in the plots using the sound cards.
So I suspect something odd is happening with the sound cards.
How quickly are you doing the frequency sweep? You are doing the LF end very slowly? If not, you don't give things time to settle down before moving frequency. Another way of looking at it is to understand that the spectrum of a frequency sweep is not necessarily flat as you have FM modulation sidebands too.
Ok I understand.
Total sweep (0 - 22050Hz) time is 2 minutes, with 0-50Hz coming up in the first 50 seconds.
I don't have the option to vary sweep time at different frequencies, however I am able to slow it down quite a bit I think.
I'll try a much slower sweep.
Total sweep (0 - 22050Hz) time is 2 minutes, with 0-50Hz coming up in the first 50 seconds.
I don't have the option to vary sweep time at different frequencies, however I am able to slow it down quite a bit I think.
I'll try a much slower sweep.
How long are you measuring at each frequency and are you taking an average? If your measurement period is shorter than your waveform period you will get uneven results like that.
I'm measuring according to the sweep speed.
I did however try another approach, and that is to play individual .wav files of 10 seconds in length at the specified frequencies.
I got the same results.
I did however try another approach, and that is to play individual .wav files of 10 seconds in length at the specified frequencies.
I got the same results.
What is producing the sweep? FMing 16Hz at 1Hz/sec is not going to produce a full amplitude 16Hz - in fact the concept is meaningless. Perhaps you need to do some reading and thinking about modulation and Fourier theory?
Also, are your individual test frequencies aligned to FFT bins? 15.87Hz is not 16Hz, so are you measuring the amount of 15.87Hz in a 10s burst of 16Hz?
To get meaningful results at LF you need to do everything very slowly.
Also, are your individual test frequencies aligned to FFT bins? 15.87Hz is not 16Hz, so are you measuring the amount of 15.87Hz in a 10s burst of 16Hz?
To get meaningful results at LF you need to do everything very slowly.
I'm feeling somewhat out of my depth now.
As I stated in my original post, I have previously just recorded RMS voltages with an audio millivoltmeter, and plotted the results in Excel to get a graph.
More recently I have used a digital 'scope with the RMS voltage, and the frequency displayed on screen, noted the two down and switched to the next frequency and so on.
I guess that attempting to automate this using a PC sound card requires a completely different approach (and one probably beyond my knowledge) - I am just a simple hobbyist (I used to fix 'stuff' before diversifying into computing).
So I guess I'll stick with my tried and tested method, however tedious it may be!
I would suggest using a software package which will get you proper measurements with your sound card. ARTA is popular and well-supported, as is AudioTester. Virtins MI is my favorite package, but it is not easy to learn and costs a bit more.
I tried Audiotester I had evaluated it previously but something put me off it - don't remember what) - but it did just crash spectacularly on my PC 😛
Evidently TrueRTA is evidently the wrong tool for the job - or - my frequency generating tools are no good.
I had noticed in the export files I created, that 16Hz (I'm sure the frequency is correct) was recorded by TrueRTA as 15.xx Hz (random).
In fact, if you look at the text output of the sweep below, you will note that quite a few frequencies do not align with the input frequency.
So I guess this is where the 'bins' don't align, and hence the inaccuracy?
Not sure if this is a TrueRTA bug, an issue with my PC or what...
Code:
15.874,6.305  < wrong
20.000,7.504
25.198,8.479 << wrong
31.748,8.596 << wrong
40.000,9.700
50.397,8.809
63.496,9.805 << wrong
80.000,9.438
100.794,9.323
126.992,9.841 << wrong
160.000,9.457
201.587,9.338 << wrong
253.984,9.640 << wrong
320.000,9.396
403.175,9.463 << wrong
507.968,9.539 << wrong
640.000,9.472 << wrong
806.349,9.457  << wrong
1015.937,9.440 << wrong
1280.000,9.421 << wrong
1612.699,9.473 << wrong
2031.873,9.443 << wrong
2560.000,9.425 << wrong
3225.398,9.417 << wrong
4063.747,9.452 << wrong
5120.000,9.392 << wrong
6450.796,9.393 << wrong
8127.493,9.418 << wrong
10240.000,9.358 << wrong
12901.592,9.315 << wrong
16254.987,9.389 << wrong
20480.000,9.218 << wrong
Last edited:
- Status
- Not open for further replies.
- Home
- Design & Build
- Equipment & Tools
- Test and measurement question