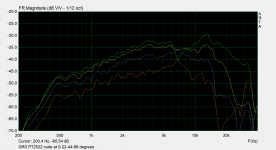
I was testing out my latest open baffle configuration, using a GRS planar tweeter of the first time. I started some response measurements, what I'm seeing as far from a flat response, more like a +15dB slope from 5kHz to 15kHz. I have two of the tweeters and they both measure the same.
Can anyone explain what's going on here?

Can anyone explain what's going on here?
I can EQ it, just seems like there might me something physically wrong with them. Have other people seen similar?It seems to be something they do. You were going to EQ them anyway?
You should to do polars to be able to tell what's going on.
Also, we were messing with a similar tweeter the other day, it needed an inductor at the top. - https://www.diyaudio.com/community/...ssover-design-help-grs-woofer-tweeter.390308/
Also, we were messing with a similar tweeter the other day, it needed an inductor at the top. - https://www.diyaudio.com/community/...ssover-design-help-grs-woofer-tweeter.390308/
Not that far off from what I've seen. They aren't that linear in a small OB and climb fast after 4k.
Hmm, they measured it at +10 dB, but probably on a large test baffle which will raise the low end, so your measurement on such a small baffle seems reasonable to me.
I have simmilar measurement of GRS PT2522 in area 2kHz - 5kHz in simillar OB.


I think it depends on shape of baffle.
If you look closer to datasheet measurements, There is huge scale on y axis, but it is 10dB differences 15kHz and 1,5kHz

I think it depends on shape of baffle.
If you look closer to datasheet measurements, There is huge scale on y axis, but it is 10dB differences 15kHz and 1,5kHz
Last edited:

He have 15uF in series 4 ohm so it is 1 st order high pass filter on 2600Hz. This is reason why is cut low end.Hmm, they measured it at +10 dB, but probably on a large test baffle which will raise the low end, so your measurement on such a small baffle seems reasonable to me.
Thanks for posting this, it certainly looks like yours and mine are doing something similar.I have simmilar measurement of GRS PT2522 in area 2kHz - 5kHz in simillar OB.
I think it depends on shape of baffle.
If you look closer to datasheet measurements, There is huge scale on y axis, but it is 10dB differences 15kHz and 1,5kHz
I put 15uF in series in vituixcad to compare measurements. I measure from 1m on axis and window is 3.3ms.


The shape is smoothing it out, but it looks like you are getting half wavelength pop around 2500hz. The front and rear come into phase and add together producing a 6db hump when the baffle separation equals a half wavelength before entering into dipole roll off. Your baffle shape is smoothing it to a decent little shelf that peaks around 2.5khz. There can often be a dip above this frequency depending on the dispersion characteristics of the driver, baffle width, rear frequency response and how much front/rear energy reaches the baffle edges.
So say you have a separation of 3 inches center to edge one side, you may expect to see a dip around 4500 and peak around 2250. You often don't see the upper dip due to driver directivity/baffle width/rear radiation that doesn't match front, etc.
So say you have a separation of 3 inches center to edge one side, you may expect to see a dip around 4500 and peak around 2250. You often don't see the upper dip due to driver directivity/baffle width/rear radiation that doesn't match front, etc.
I was testing out my latest open baffle configuration, using a GRS planar tweeter of the first time. I started some response measurements, what I'm seeing as far from a flat response, more like a +15dB slope from 5kHz to 15kHz. I have two of the tweeters and they both measure the same.
Can anyone explain what's going on here?
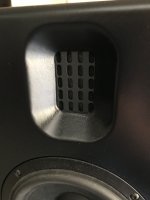
You made no mention of how you measured these. In the picture the MT section is sitting on a large flat surface and is also near walls. These surfaces will create large reflections in measurements that will cause huge peaks and dips. Also the baffle width, which is a few times wider than the radiating surface of the tweeter, will cause some FR issues. It will anything but flat. The MFG plot is probably made on an IEC (e.g. large) baffle, with is very different from your setup.
I have used this tweeter nude, and measured under quasi-anechoic conditions. No cap was used. The response is shown in the attached figure. I noticed you only measured on one axis. Because of the design of the tweeter, even nude there is an on axis dip and off axis peaking around 7kHz (the figure shows the off axis response in the horizontal direction). So where you measure it makes a difference.
Attachments
I use mine in a custom shallow waveguide and that flattens the response a bit.

2nd order passive XO at 3.5kHz.

Same waveguide in dipole open baffle with a wider 12in baffle works very well too:

2nd order passive XO at 3.5kHz.
Same waveguide in dipole open baffle with a wider 12in baffle works very well too:
Is it shown with polars? A response measurement is an arbitrary thing, you can't tell whether using a waveguide is beneficial that way.
Ok, here's some more data. I printed up a simple waveguide and did a horizontal off-axis sweep with and without the waveguide.


Very interesting. And so simple to stick a wave guide overlay on the baffle. It looks like it was always going to be designed like that, and I really like the orange. Makes me want to find someone local with a 3d printer
Yeah, it’s nice to be able too experiment. I’m thinking of trying a kind of waffle shaped phase plug to sit between the apertures in the face of the tweeter. Can’t hurt to try.Very interesting. And so simple to stick a wave guide overlay on the baffle. It looks like it was always going to be designed like that, and I really like the orange. Makes me want to find someone local with a 3d printer
Something that's worked well for me, is that it's possible to mask off part of a ribbon.
By masking off the edges, it widens the beamwidth of the tweeter, because the exit of the tweeter is narrower.
You can't mask off A LOT of the tweeter, but you can mask off a little. You would think that it would reduce the output, but it doesn't reduce it very much, particularly if you insert a small gap so that the sound can still escape. The idea is to delay the output from the edges a little bit, which also widens the beamwidth, because delaying the edges curves the wavefront by delaying the output of the edges of the ribbon relative to the center of the ribbon.
If you really wanted to crazy with it, you could probably mask off part of the sides AND the top. But I'd start with just the sides.
- Home
- Loudspeakers
- Multi-Way
- Strange response from GRS PT2522-4 in open baffle