I'm learning how to use Speaker Workshop and part of that is generating FRD and ZMA files from fr and impedance plots using SPL Copy.
I've never encountered such a tempermental program in my life! I've spent hours and hours trying to get it to work smoothly and with some success but some graphs it seems to just refuse to read.
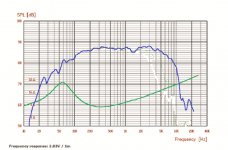
What I've discovered is that it seems to prefer JPEG files to Bitmap, larger pictures to smaller ones, thicker lines to thin ones and blue to red colored lines.
But the plot below I just can't get it to trace properly. (I've made the lines a bit thicker in Paint.) It usually generates an error message with something about exceptions and the position of the cursor even though the position I use has worked with other graphs. I have tried many different positions and it doesn't seem happy with any of them! And occassionally when it does start normally it wants me to guide the cursor with the mouse manually and after 5 minutes or so of this it skates off across the page like a puck on ice.
Any ideas or hints? Can anyone with more experience get a trace from this graph? This is with a Windows 7 platform.
I've never encountered such a tempermental program in my life! I've spent hours and hours trying to get it to work smoothly and with some success but some graphs it seems to just refuse to read.
What I've discovered is that it seems to prefer JPEG files to Bitmap, larger pictures to smaller ones, thicker lines to thin ones and blue to red colored lines.
But the plot below I just can't get it to trace properly. (I've made the lines a bit thicker in Paint.) It usually generates an error message with something about exceptions and the position of the cursor even though the position I use has worked with other graphs. I have tried many different positions and it doesn't seem happy with any of them! And occassionally when it does start normally it wants me to guide the cursor with the mouse manually and after 5 minutes or so of this it skates off across the page like a puck on ice.
Any ideas or hints? Can anyone with more experience get a trace from this graph? This is with a Windows 7 platform.
Attachments
Last edited:
I just tried redoing the line in green in Paint and I had to guide the cursor manually with the up/down keys (sorry not the mouse) and I get to 88% and then the cursor gets stuck. Happened twice. Maybe the manual version SPL 'Trace' is the way to go with these graphs but I can't seem to find it on the web anywhere. Anyone got a link or a copy they can email to me? Can these FRD/ZMA files be created manually in notepad just from reading the graphs manually?
I use the manual SPL Trace, but there are better programs. I used to have one that someone mentioned here. It was quick and good.
Maybe someone will help out with a good suggestion.
Maybe someone will help out with a good suggestion.
Thanks Pano. If I send you a PM with my email would you be able to send me the SPL exe file as an attachment, or is it too big?
I actually went back to the original graph on the manufacturer's spec sheet, just resized it bigger (didn't erase the off axis plots this time, or thicken the line) and tried SPL Copy again and it worked this time, with about 50% manual input. So I guess if it doesn't work in one format, size, color, thickness it's worth trying in another. There seems no rhyme or reason as to what works with this program.
I actually went back to the original graph on the manufacturer's spec sheet, just resized it bigger (didn't erase the off axis plots this time, or thicken the line) and tried SPL Copy again and it worked this time, with about 50% manual input. So I guess if it doesn't work in one format, size, color, thickness it's worth trying in another. There seems no rhyme or reason as to what works with this program.
That is where I originally downloaded SPLCopy from, but I downloaded the 3 part files which contain SPLCopy and not the 'SPLminum' file which I have now discovered contains the SPLtrace. Now I have it! Thanks very much for your assistance Tony.
Same problem with SPLcopy...no better luck with trace
OK so I'm trying to follow the "how to design a speaker/crossover without measurement equipment" guides I've found and read here and on other sites for a speaker project I've been banging my head against for a while. Just when I thought I saw some light, and found a couple of guides that made some sense to me. I run into these issues that prevent me from moving forward.
1) SPLcopy doesn't work properly for me no matter what I try...the published datasheets for my drivers are just too rough it seems, so the automatic cursor just wanders across the page endlessly finding what path it wants and even if I manage to move it manually for most of the trace I get an error message at the end of the range and no useable trace. I gave up on it.
2) SPLtrace. I have (somewhat) successfully used this program and created a trace file by importing the graph copied from a datasheet, setting up the frequency and amplitude ranges and manually tracing and saving. The only problem is that when I go to open the trace file with SPLview, although I get a plot that looks to be the correct shape, it is completely over the wrong frequency and amplitude range. Like this...
Original datasheet image

My SPLtrace viewed in SPLview

What gives? I tried redoing it several times. Tried on two different computers. Something made me think it had to do with selecting the corresponding number of data points in both programs...but even if I set the number of points the same I get the same image in SPLview. My second older computer running XP just defaults the data point number pop up to free trace...that doesn't make a difference either.
OK so I'm trying to follow the "how to design a speaker/crossover without measurement equipment" guides I've found and read here and on other sites for a speaker project I've been banging my head against for a while. Just when I thought I saw some light, and found a couple of guides that made some sense to me. I run into these issues that prevent me from moving forward.
1) SPLcopy doesn't work properly for me no matter what I try...the published datasheets for my drivers are just too rough it seems, so the automatic cursor just wanders across the page endlessly finding what path it wants and even if I manage to move it manually for most of the trace I get an error message at the end of the range and no useable trace. I gave up on it.
2) SPLtrace. I have (somewhat) successfully used this program and created a trace file by importing the graph copied from a datasheet, setting up the frequency and amplitude ranges and manually tracing and saving. The only problem is that when I go to open the trace file with SPLview, although I get a plot that looks to be the correct shape, it is completely over the wrong frequency and amplitude range. Like this...
Original datasheet image
My SPLtrace viewed in SPLview
What gives? I tried redoing it several times. Tried on two different computers. Something made me think it had to do with selecting the corresponding number of data points in both programs...but even if I set the number of points the same I get the same image in SPLview. My second older computer running XP just defaults the data point number pop up to free trace...that doesn't make a difference either.
It's been a while since I played with spltrace, but it looks to me like you didn't set the initial limits for the frequency range. I'm not 100% sure but I think I had to manually enter the minimum and maximum frequencies after clicking on the graph.
Tony.
Tony.
It's been a while since I played with spltrace, but it looks to me like you didn't set the initial limits for the frequency range. I'm not 100% sure but I think I had to manually enter the minimum and maximum frequencies after clicking on the graph.
Tony.
Yup...I did that before. For some reason it didn't have any effect on the outcome for my machine running Vista 64. I had always set the range in the trace options pop up but let it default to 400 points. I tried resetting the number of points as well to make it easier to test and see if I could get it to view properly in SPLview if I set the same number there with the normalize data option.
I tried again, this time on my older machine which is running XP. Opened up my .pdf data sheet with Reader...selected the graph with the snapshot tool and copied it to the clipboard...opened trace...imported it...set all the alignments for Freq and Amplitude...this time instead of free trace in the options screen I selected the specific Freq range again and set a low number of points (40) since I hadn't tried that on the XP machine.
For the first time as I was tracing the grey field on the left hand side of the screen started jumping across the graph as I selected points. It was jumping ahead of what I would want to plot, but 40 clicks later I saved and then took a look in SPLview and BINGO! Finally got something plotted over the correct range! Now I'll go back and do a proper trace with more detail and hope it goes as well.
I guess there was and issue with trying to run the program on Vista 64? I know I tried the same exact procedure several times over on that machine...oh well at least I've made progress! I done learnt sometin! 😀
BTW...thanks Tony
Last edited:
- Status
- Not open for further replies.
- Home
- Design & Build
- Software Tools
- SPL Copy newbie problems