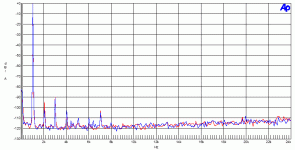
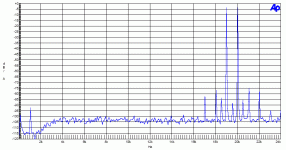
attached the 8ohm 1W FFT
Red line is right channel, blue is the left channel.
1KHz ouput 2.8Vrms, set as 0dBr reference.
K2 = -95dBr = 0.0018%
K3 = -90dBr = 0.0032%
K4 = -103dBr = 0.0007%
Calculated THD (noise not included) = sq rt(K2^2 +K3^2 +K4^2) approximately 0.004%
when using calculation from the AP2 THD+N is 0.015%
Figure from AP2 seems higher than the FFT have shown. I suspect this is due to out of band energy. The AP2 I used doesn't contain the AES17 filter, so I used the build in 20KHz filter instead.
Maybe I should try adjusting the analog analyzer's bandwidth to see if I can get better figure.
Nevertheless, -90dBr K3 and <110dB noise floor are impressive.
Attachments
banana said:attached the 8ohm 1W FFT..
..Nevertheless, -90dBr K3 and <110dB noise floor are impressive.
If you need only several watt's, in other words <50W, then you can be much more impressed by using some output stage chip from TI, Philips etc in the selfoscillating configuration. E.g.: http://www.diyaudio.com/forums/showthread.php?postid=740168#post740168
It would be interesting to run a THD vs frequency at different power levels. I did that on a module from the same OEM company and found it rather disappointing, so I'd be curious if any improvement has been made.
For the record I'm not at present affiliated with any manufacturer, lest some accuse me of being biased.
For the record I'm not at present affiliated with any manufacturer, lest some accuse me of being biased.
I see noise floor rise according frequency (at the AP screenshot from banana), so seems THD/Freq isn't flat at all.koolkid731 said:It would be interesting to run a THD vs frequency at different power levels. I did that on a module from the same OEM company and found it rather disappointing, so I'd be curious if any improvement has been made.
For the record I'm not at present affiliated with any manufacturer, lest some accuse me of being biased.
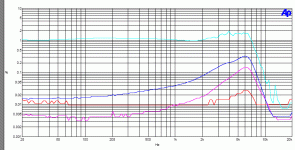
THD vs output power
Blue line is 8ohm load, red line is 4ohm.
I'm becoming more and more convinced that the 0.015% THD+N was quite real, most of it being inband noise.
I've tried different filter, with 20KHz filter the residue noise level is about -77dBr (reference to 2.83V). But even with A-weighting, or 400Hz highpass filter, it is still only -78dBr.
Attachments
Thank you Banana for your posts.
I usually make measurements with AES17 40kHz filter to capture 2nd harmonics of 20kHz signal, and publish graphes with AES17 30kHz filter.
It's also good idea to document the curves of each plot - which is which at what conditions? - and I use abbreviations such as f3 for 30kHz filter, f4 for 40kHz filter, 8R for 8-ohm load etc...They make later analyses easier.
Sorry to hear you're not with what's their names anymore.... I'd have quit too, we'll not speak of this again 🙂
Capturing 40kHz with a 40kHz cut off seems.. well... what's the point?
Capturing 40kHz with a 40kHz cut off seems.. well... what's the point?
classd4sure said:Sorry to hear you're not with what's their names anymore.... I'd have quit too, we'll not speak of this again 🙂
Capturing 40kHz with a 40kHz cut off seems.. well... what's the point?
Nothing to sorry about. It's a huge improvement for my pocketbook, and so many exciting custom products for OEMs to develop, and sole ownership of latest and greatest IP.
Re. 40kHz filter, it does pass 40kHz with minimum attenuation.
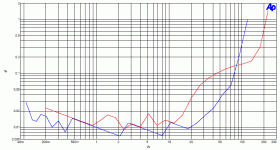
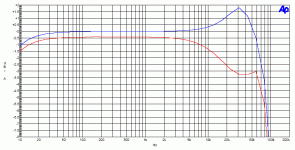
Super-T Frequency Response
Output level is 2.83Vrms, volume control set to maximum.
Blue trace is 8ohm load, Red trace is 4ohm. The curves for open circuit load is not shown, but it has more than 10dB peak at 30KHz when unloaded.
Seems like the output filter is not as optimised as the Acoustic Reality.
Output level is 2.83Vrms, volume control set to maximum.
Blue trace is 8ohm load, Red trace is 4ohm. The curves for open circuit load is not shown, but it has more than 10dB peak at 30KHz when unloaded.
Seems like the output filter is not as optimised as the Acoustic Reality.
Attachments

Banana, it is obvious from your THD vs Frequency plots that you have a 20kHz filter set on the AP. Either that or this amplifier has some serious roll off at higher frequencies. You should really be testing with the AP AUX-0025 Class D measurement filter. Here is a link.
(http://www.audioprecision.com/index.php?page=products&category=&id=1100001007)
What do those same curves look like with the 30kHz AP filter setting and then 80kHz? I personally wouldn't use an A-wtg filter to take such graphs and then show them to others.
If the roll off is not due to the AP filter setting then you should A/B compare this amp to another (not class D) because you will have too much phase shift in the treble to sound very good.
-SL
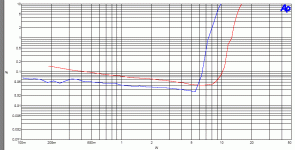
THD+N vs Output Power
The Super-T was powered by a 12V 4A switching AC adaptor. My friend gave me this adaptor and I'm not sure whether it's the stock one.
Again Blue trace is 8ohm load, Red is 4ohm.
Using 1% THD limit, the Super-T only gives a little more than 7W at 8ohm load. Looking at the 10% THD point, it's close to 10W then.
Attachments
- Status
- Not open for further replies.
- Home
- Amplifiers
- Class D
- Some measurement of commercial class D