I just wanted to get any comments, thoughts, questions, about distortion measurements, because I'm new to this.
I built two pairs of very similar MTM floorstanders, in identical enclosures:
Both have 30-litre bass reflex enclosures, the port lengths are a bit different.
I wanted to see how different they'd sound.
Anyway, my question is about the distortion measurements I did. I put my calibrated EMM6 mic on-axis, 36" from the tweeter centre, hooked up my Focusrite Scarlett 2i2 v2 audio interface, and did some distortion measurements, first with ARTA STEPS (stepped sine) then with ARTA itself (swept sine).
Here they are:
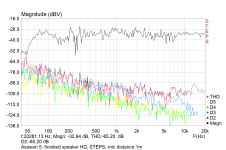
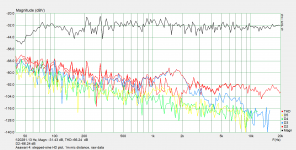
Asawari 5: metal cone and Seas tweeter: stepped sine

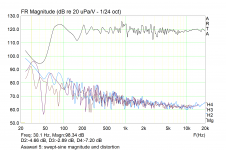
Asawari 5: metal cone and Seas tweeter: swept sine

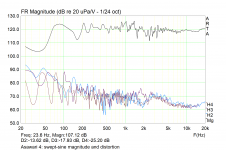
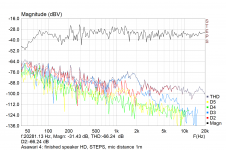
Asawari 4: paper cone and Vifa tweeter: stepped sine

Asawari 4: paper cone and Vifa tweeter: swept sine

My mic is not calibrated to any specific SPL, so the SPL values on the Y axes are not absolute.
What do you think? Are these graphs useful? Can they be improved? I really wish ARTA had the ability to smooth the STEPS distortion graphs, or even average them over multiple recordings.
I built two pairs of very similar MTM floorstanders, in identical enclosures:
- RS180 metal cone, Seas TDFC tweeter, Fc 1.5KHz, 6th order slopes
- RS180P paper cone, Vifa XT25TG30 double ring radiator, Fc 2.2KHz, 4th order slopes
Both have 30-litre bass reflex enclosures, the port lengths are a bit different.
I wanted to see how different they'd sound.
Anyway, my question is about the distortion measurements I did. I put my calibrated EMM6 mic on-axis, 36" from the tweeter centre, hooked up my Focusrite Scarlett 2i2 v2 audio interface, and did some distortion measurements, first with ARTA STEPS (stepped sine) then with ARTA itself (swept sine).
Here they are:
Asawari 5: metal cone and Seas tweeter: stepped sine
Asawari 5: metal cone and Seas tweeter: swept sine
Asawari 4: paper cone and Vifa tweeter: stepped sine
Asawari 4: paper cone and Vifa tweeter: swept sine
My mic is not calibrated to any specific SPL, so the SPL values on the Y axes are not absolute.
What do you think? Are these graphs useful? Can they be improved? I really wish ARTA had the ability to smooth the STEPS distortion graphs, or even average them over multiple recordings.
Attachments
Without knowing the actual SPL and voltage applied, the graphs are not very useful.
Although the distortion indicated would be outstanding (and impossible) for the speakers if they actually produced 125 dB at 36 inches (one meter is 39 inches, close enough..), the graphs simply indicate that there is nothing too out of the ordinary going on at whatever voltage level was applied.
Although the distortion indicated would be outstanding (and impossible) for the speakers if they actually produced 125 dB at 36 inches (one meter is 39 inches, close enough..), the graphs simply indicate that there is nothing too out of the ordinary going on at whatever voltage level was applied.
Member
Joined 2003
From discussion in the ARTA thread, stepped sine should be more accurate, at least at low frequency as it is more resilient to room interaction. Swept sine is mostly adequate as long as room reflections are kept to a minimum. That said, 1m is not necessary, you can move the mic closer to say 0.5m to reduce room influence.
From my experience, EMM6 is a poor mic for distortion analysis, shows artificially high 2nd order distortion in my testing and has rather high self-noise, but you can't ask for much from a low cost small condenser.
SPL, mic used, distance, etc all play a role in measured distortion performance, so strict controls need to be put in place to create results that can be directly compared. For analysis of driver characteristics, breakup issues, etc. you are on the right track, however from the rising levels at low frequency I would suspect that the actual SPL of the measurement was not very high.
Thanks for chipping in, I have many questions.
I am doing these measurements with the aims of (i) doing xo design and deciding of Fc based on distortion graphs, and (ii) checking a finished speaker's performance to see whether there's anything off somewhere. I don't exactly know what I'm looking for in the second goal. [emoji3] It's more of a sanity check and final corroboration of various things.
I intend to do future measurements at 2.83V. I don't have an SPL meter, so I can't calibrate the absolute dB level of my measuring rig.
I have many questions.
Is there a way, in ARTA or STEPS, to get the distortion graphs normalised to flat 0dB magnitude, the way the graphs on hificompass are? I'd like to standardise on that depiction if I can, because all I'm interested in is HD relative to the fundamental anyway.
Why are the STEPS distortion graphs so "hairy"? Shouldn't the room-reflection insensitivity make those graphs smoother? Is it better if one does, say, 1/6-octave steps instead of 1/24-oct like I did? I wish STEPS had an averaging feature to smoothen the lines out.
The fundamental lines in the STEPS graphs seem to be quite flat, barring smoothing, to my eyes. Is this good, normal, not particularly smooth -- any comments? I aim for on-axis flat SPL, and I know that power response matters more, etc, but I was just wondering how far the STEPS fundamental can be trusted.
Is there anything to be gained from swept-sine graphs, if one has STEPS outputs? Can I stop doing the swept-sines?
Do you have recommended values for the various timings and delays for STEPS setup for speaker measurements? I believe longer duration beeps help eliminate room modes more?
Should I move the mic closer than 1m? If I was measuring one driver at a time I'd have used 31cm simply because I've seen hificompass do it, but my speakers are MTM, so I was wondering about the off-axis comb filtering and phase alignment issues if I shifted much closer than 1m. For future measurements of individual drivers, I'll do 31cm and nearfield measurements.
I'm quite surprised that the distortion graphs of the midbasss and tweeter blend so smoothly, and for two quite different pairs of drivers. I'd expected to see some sort of step in the HD at the Fc. Is this smooth merging normal across drivers?
Looking at the graphs of the two speakers, would you say that the Asawari 5 (metal cone, Seas tweeter) has slightly lower overall HD compared to the other one (paper cone, Vifa tweeter)? I mean, one big point of this entire exercise is to make such judgment calls, nodding our heads safely, right? [emoji3]
Last edited:
Member
Joined 2003
Yes, for either method, when you view distortion as percentage, this is exactly what happens, it is a normalized graph. You can always export the result to CSV file and complete any processing you desire in excel as well.Is there a way, in ARTA or STEPS, to get the distortion graphs normalised to flat 0dB magnitude, the way the graphs on hificompass are? I'd like to standardise on that depiction if I can, because all I'm interested in is HD relative to the fundamental anyway.
It's literally stepped, there is no smoothing, just connect the dots with straight lines between each step. 1/6 octave would have much less resolution of information, but would complete faster.Why are the STEPS distortion graphs so "hairy"? Shouldn't the room-reflection insensitivity make those graphs smoother? Is it better if one does, say, 1/6-octave steps instead of 1/24-oct like I did? I wish STEPS had an averaging feature to smoothen the lines out.
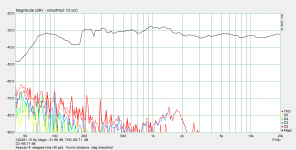
The frequency response is what is is for the driver tested. Flat is not necessary, many drivers aren't flat, but relative SPL at any frequency should be considered when interpreting the results. I wouldn't necessarily call what you measured flat, we are looking at 12dB/division chart after allThe fundamental lines in the STEPS graphs seem to be quite flat, barring smoothing, to my eyes. Is this good, normal, not particularly smooth -- any comments? I aim for on-axis flat SPL, and I know that power response matters more, etc, but I was just wondering how far the STEPS fundamental can be trusted.
Speed. Depending on your living conditions, cycle time of background noise like furnace, AC, fridge, pets, etc. speed of the test may have a lot of benefit to keep background noise to a minimum, as often the intended data is only 0.1% or less from the fundamental, keeping noise floor to a minimum is important for the duration of the test.Is there anything to be gained from swept-sine graphs, if one has STEPS outputs? Can I stop doing the swept-sines?
Perhaps others can chime in on that, I haven't found adjusting those values to have any meaningful impact on test results.Do you have recommended values for the various timings and delays for STEPS setup for speaker measurements? I believe longer duration beeps help eliminate room modes more?
I generally do 0.5m. Keep in mind the SPL at the mic, most condenser capsules start to give up around 120dB if you're measuring nearfield at high SPL. distortion products aren't dependent on frequency response, but obviously you want to measure where you don't have huge nulls in the response.Should I move the mic closer than 1m? If I was measuring one driver at a time I'd have used 31cm simply because I've seen hificompass do it, but my speakers are MTM, so I was wondering about the off-axis comb filtering and phase alignment issues if I shifted much closer than 1m. For future measurements of individual drivers, I'll do 31cm and nearfield measurements.
I'm not sure of the SPL that you've measured at, but the results appear to be fairly low measuring mostly noise floor. . Try higher SPL, crank it up until it is uncomfortable 🙂I'm quite surprised that the distortion graphs of the midbasss and tweeter blend so smoothly, and for two quite different pairs of drivers. I'd expected to see some sort of step in the HD at the Fc. Is this smooth merging normal across drivers?
Last edited:
Thanks for all the inputs, I'll put them to use and post more findings.
About the STEPS distortions being "hairy", my point was that it's unlikely that a specific HD will jump up and down by 10dB or 12dB when I step 1/24 octave. So I thought that the "hairiness" is a measurement artefact. I'll ask Ivo Mateljan.
Your point about swept sine being useful to eliminate noise was quite insightful; it had never occurred to me. I'd thought that stepped sine would show more noise immunity, because the software would know at each step what were the expected harmonics frequencies and would filter accordingly, thus being immune to all noise which didn't match one or other of the harmonic frequencies.
And about SPL, I'll definitely try higher SPL next time and see. It will give better noise immunity but will also give higher levels of distortion I guess, because of the increased cone excursion?
I tried smoothing the magnitude plot (I wish STEPS would let me smooth the HD lines too) and it began to look pretty flat to me.I wouldn't necessarily call what you measured flat, we are looking at 12dB/division chart after all
Raw data from yesterday's measurements:
Same data with magnitude smoothed 1/3 oct (thats the least smoothing STEPS is willing to do):
It's not the flattest we've seen, I agree, but it begins to look pretty decent. From 200Hz and above, it seems to fall in a +/-3dB band. Which is very pleasant considering that this is in-room response.
Attachments
https://www.diyaudio.com/community/threads/sound-quality-vs-measurements.200865/post-6679760
andrea mori writes: "Just out of curiosity I ask who knows more than me"
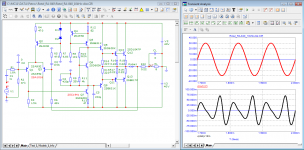
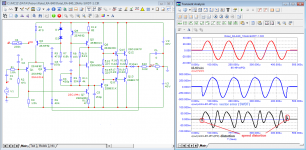
Conventional measurements are carried out in a steady state and do not provide information about the operation of the amplifier in reality.
This became clear in the late 1950s. These problems were most fully described in Rakovsky's book "Measurements in film sound recording equipment".
Not surprisingly, many authors have tried to come up with new tests that would give a more complete picture of the distortion introduced by amplifiers. The most famous authors of such attempts are Mati Otala, David Hafler, Jiri Dostal and many others.
I tried to supplement the material presented in Rakovsky's book in the following way.
andrea mori writes: "Just out of curiosity I ask who knows more than me"
Conventional measurements are carried out in a steady state and do not provide information about the operation of the amplifier in reality.
This became clear in the late 1950s. These problems were most fully described in Rakovsky's book "Measurements in film sound recording equipment".
Not surprisingly, many authors have tried to come up with new tests that would give a more complete picture of the distortion introduced by amplifiers. The most famous authors of such attempts are Mati Otala, David Hafler, Jiri Dostal and many others.
I tried to supplement the material presented in Rakovsky's book in the following way.
Attachments
John Curl said well about the acceptable levels of non-linear distortion:
https://www.diyaudio.com/community/threads/sound-quality-vs-measurements.200865/post-2832162
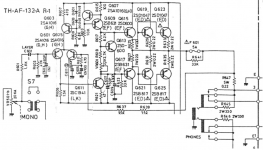
a colleague really wants to find out why, of all the amplifiers, his wife did not reject the Rotel RB-840 amplifier
https://www.diyaudio.com/community/threads/sound-quality-vs-measurements.200865/post-2830898
let's try to figure it out.
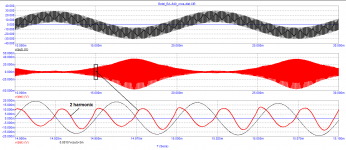
As tests show, the amplifier does not need an output inductance to ensure stable operation.
At a quiescent current of 100 mA per output transistor, there are no switching distortions in the distortion products, and there are also no high-speed distortions.
The distortion spectrum is decreasing,
https://www.diyaudio.com/community/threads/sound-quality-vs-measurements.200865/post-2832162
a colleague really wants to find out why, of all the amplifiers, his wife did not reject the Rotel RB-840 amplifier
https://www.diyaudio.com/community/threads/sound-quality-vs-measurements.200865/post-2830898
let's try to figure it out.
As tests show, the amplifier does not need an output inductance to ensure stable operation.
At a quiescent current of 100 mA per output transistor, there are no switching distortions in the distortion products, and there are also no high-speed distortions.
The distortion spectrum is decreasing,
Attachments


- Home
- Loudspeakers
- Multi-Way
- Some distortion measurements