Hello, all
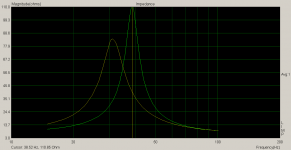
Upon receiving my Visaton AL 200s I was amazed at what large an effect the driving voltage has on their impedance and therefore on the measured Thiele-Small parameters. I measured them in LIMP with a 15-Ohm reference resistor using the stepped-sine method at different voltages at the amplifier output, which revealed a general tendency for Fs and Zmax to decrease as voltage increased. Here are the results of two measurements:
The corresponding impedance graphs are attached.
Is this the expected behaviour, and if so, why do manufacturers not specify the method and signal magnitude whereby their datasheet figures were obtained? Should not one measure the small-signal parameters with the smallest signal capable of yielding the required signal-to-noise ratio?
Upon receiving my Visaton AL 200s I was amazed at what large an effect the driving voltage has on their impedance and therefore on the measured Thiele-Small parameters. I measured them in LIMP with a 15-Ohm reference resistor using the stepped-sine method at different voltages at the amplifier output, which revealed a general tendency for Fs and Zmax to decrease as voltage increased. Here are the results of two measurements:
Code:
Udr, V   Fs, Hz   Zmax, Ohm
--------------------------
2.56     31.5     83.5
0.16 38.5 110.9Is this the expected behaviour, and if so, why do manufacturers not specify the method and signal magnitude whereby their datasheet figures were obtained? Should not one measure the small-signal parameters with the smallest signal capable of yielding the required signal-to-noise ratio?
Attachments
I was amazed at what large an effect the driving voltage has on their impedance and therefore on the measured Thiele-Small parameters.
Is this the expected behaviour
Yes, quite normal.
and if so, why do manufacturers not specify the method and signal magnitude whereby their datasheet figures were obtained?
I have often wondered that too.
Should not one measure the small-signal parameters with the smallest signal capable of yielding the required signal-to-noise ratio?
Yes.
Yes.Should not one measure the small-signal parameters with the smallest signal capable of yielding the required signal-to-noise ratio?
Does that mean that my AL 200s are deficient? Their Fs measured using pink noise is 40Hz instead of the declared 32 Hz...
Nothing is likely wrong with your woofers.
Post your measurements and the specs side by side.
Measure the specs at a given room temp, then run the driver for 5 minutes with a really low frequency (5-10Hz) at a fair excursion (maybe 3-5mm) Then immediately measure T/S with a quick method. Then disconnect them and let them rest a day and measure again at the same room temperature. Put them in the refrigerator (or outside in the cold) for a couple hours and then measure.
Even more telling, try modeling each set of specs in the same size box....
T/S parameters are a moving target. Published specs often show a larger compliance and lower resonance than any actual part will show. Most often, they will model within a fraction of a dB of the published specs in the same box, because many types of boxes are insensitive to compliance variations.
Measure the specs at a given room temp, then run the driver for 5 minutes with a really low frequency (5-10Hz) at a fair excursion (maybe 3-5mm) Then immediately measure T/S with a quick method.
Here are the quick (small-signal) measurements before and after warm-up:
Code:
+-----------------------------+
|     Spec   Fresh   Warmed-up|
+-----------------------------+
|Fs   32.0   39.3    37.6     |
|Qt    0.35  0.50    0.45     |
|Qe    0.39  0.54    0.48     |
|Qm    3.73  8.41    7.19     |
+-----------------------------+Here is what I got from large-signal (2.54 V at the amplifier) and small-signal measurements:
Code:
+--------------------------+
|       Spec   Small  Large|
+--------------------------+
|Fs     32.0   39.2   32.0 |
|Qt      0.35   0.50   0.38|
|Qe      0.39   0.54   0.41|
|Qm      3.73   8.41   4.59|
|Vas    77.0   33.2   65.5 |
|Zres   ?      115    83   |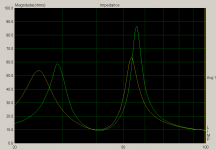
+--------------------------+By emulating the measured impedance graphs in WinIsd for my 60-litre box tuned to 40.5 Hz I ended up with these, quite bizarre, parameters:Even more telling, try modeling each set of specs in the same size box....
Code:
+---+--------------+-------------+
|   |    Small     |    Large    |
|   | Model   Obs. | Model   Obs.|
+---+--------------+-------------+
|Ql | 500     -    | 250     -   |
|Qa | 500     -    | 250     -   |
|Qp | 15      -    | 13      -   |
+---+--------------+-------------+
|f1 | 27.7    28.6 | 22.5    24.6|
|Z1 | 57.4    58.7 | 53.5    53.8|
|f2 | 57.2    56.0 | 57.3    53.5|
|Z2 | 84.9    86.7 | 62.2    63.7|
+---+--------------+-------------+My port is probably as lossy as the model says, because by way of experiment it was made of a circular disk mounted against the inner surface of the front panel, where a cutout is made to the driver's diameter, and the 40 Hz tuning is achieved when the distance between the disk and panel is 8 mm. This narrow passage may impose friction to the air flow.
The simulated and measured impedance graphs are attached, where the small-signal measurement and simulation is shown in green and large-signal ones in yellow.
The simulated frequency responses do not, indeed, differ much and run in parallel with about 1.0-1.5 db difference.
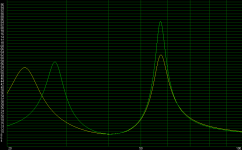
There is also an anomalous (i.e. not accounted for in WinISD 🙂 increase of the impedance maximum in the closed box (91.1 Ohm) with respect to that in free air (83.4) when measured at large signal. It is shown in the third attached image. Small-signal measurements do not reveal this effect, showing a constant maximum impedance of 115.3 Ohm both in free air and in the closed box. Does that mean that my box has negligible losses?
Attachments

Are those graphs measurements or simulations using measured T/S parameters?
I suspect the simplest explanation for the third graph is a value of Rms (Qms) that changes with frequency. T/S theory (thus WinISD) assumes all of the values are invariant, but as you have seen, they vary with frequency and amplitude.
It could also be a change in mass between free air and baffle mounting.
Also, for your first chart, Zmax (Zres) can be calculated - Zmax=Re*(1+Qms/Qes)
They are mentioned in the text on order of appearance and the files are named accordingly: 1) measurements in the vented box with a small (green) and large (yellow ) signal, 2) simulation of the vented box with the parameters estimated from small- and large-signal measurements, 3) Impedance in free air and the closed box measured using the "large" singal (2.56 V at the amp).Are those graphs measurements or simulations using measured T/S parameters?
Could be that or the dependency on amplitude, because a different compliance causes a different amplitude.I suspect the simplest explanation for the third graph is a value of Rms (Qms) that changes with frequency. T/S theory (thus WinISD) assumes all of the values are invariant, but as you have seen, they vary with frequency and amplitude.
It does not look it, for I did test the woofer in my box without the back panel, finding no signinficant difference in the impedance peak, and should not the baffle decrease the impedance peak?It could also be a change in mass between free air and baffle mounting.
Do you mean the free-air impednace? In WinISD the peak height depends also on BL and Vas (sic).Also, for your first chart, Zmax (Zres) can be calculated — Zmax=Re*(1+Qms/Qes)
Do you mean the free-air impednace? In WinISD the peak height depends also on BL and Vas (sic).
Try Zmax=Re*(1+Qms/Qes) and you will see that it works. Qms/Qes is also equal to BL^2/(Re*Rms), so Zmax=Re+Bl^2/Rms - no dependence on Vas or compliance. Bl^2/Rms is also known as Res, the motional impedance at resonance.
To help understanding parameter shifts, try calculating fundamental parameters rather than just looking at combination parameters (Vas, Qxx, etc...) I am not sure how you are measuring parameters, but it could help to measure Re accurately +/-~0.01 ohm and "fix" it in calculations.
A naive calculation shows Rms about 1.14 for your small signal specs and 0.96 for your large signal tests. IF you extract the sealed box Qec, Qmc Fc and such from the sealed box impedance, you can calculate Rmc, the lumped mechanical resistance in the closed box. Trying to understand parameter shifts through measurements in damped or lossy boxes is going to add to the confusion. I think parameter shifts with frequency and level are what is behind your odd enclosure damping values, I would expect Ql to be lower and none of the values would be much over 100.
Generally there will be a slight change in resonant frequency between free air and baffle mounting due to a change in load on the diaphragm - the parameters change slightly from free air when mounted in a baffle. The baffle mounted (or appropriately adjusted) parameters are what should be used in box calculations. Most miss this, but it is in Small and Thiele's papers. The changes in parameters with frequency and level make all of this somewhat an exercise in chasing one's tail, however.
Theoretically, IIRC, the air load will double between free air and infinite baffle mounting. The effect will be proportionally stronger for low mass (and larger) drivers.
Last edited:
Thank you, Ron.
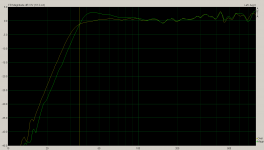
In order not to build sand castles, I decided to measure the frequency response of my box. It seems possible because the circular port is co-axial with the woofer and a microphone at a 6 cm distance to the front panel is equally close to woofer and port and coaxial with both, while the front panel of my box is 53 by 53 (bad idea but I needed it for my circular port) cm so diffraction should not have a serious effect.
Attached is the frequency response that I measured in this manner with the port tuned to 34 (yellow) and 38 Hz (green). The most amazing thing is the roll-off of about 32 db/oct. Whence may it come?
Attachments
Attached is the frequency response that I measured in this manner with the port tuned to 34 (yellow) and 38 Hz (green). The most amazing thing is the roll-off of about 32 db/oct. Whence may it come?
Mutual coupling, perhaps?
There's a tendency on this forum to confuse the electrical equivalent model of drivers with the Bible and the US Constitution. I could say it was a pretty good model but then I really don't know what I'd evidence I have for that. I suppose with enough fudge factors, it would be pretty good.
One helpful fudge factor might be for the material the surround is made of. Or heating, as many good people on this forum mention all the time. Or, as the OP convincingly demonstrates, the signal level.
My lesson from this thread so far, is that it is treacherous to used a bass-reflex design (or various other designs like that mis-named quarter-wavelength "horn") when they are based on having a stable driver resonance which works against the enclosure resonance (which is quite stable once constructed and the weather doesn't change).
So the problem is not that the beloved T-S parameters aren't the complete description of driver behaviour, but that people sometimes think they are. Just a model that is good enough for purposes until you start sawing lumber to build a cabinet.
Ben
There's a tendency on this forum to confuse the electrical equivalent model of drivers with the Bible and the US Constitution. I could say it was a pretty good model but then I really don't know what I'd evidence I have for that. I suppose with enough fudge factors, it would be pretty good.
The evidence of 100 years or so of empirical results and the hundreds of examples of good sims matching measurements on this forum alone aren't enough for you?
One helpful fudge factor might be for the material the surround is made of. Or heating, as many good people on this forum mention all the time. Or, as the OP convincingly demonstrates, the signal level.
Hopefully everyone here is aware that things are not linear when pushed to the limits, and Klippel results clearly show the effect that non linearity has at the limits. There's even a method built into the Klippel interpretation guidelines that predicts a certain amount of distortion per non linearity.
A quick look at the ascending power level testing done at data-bass.com for all it's driver tests will show that the response remains remarkably linear until the power level is at least moderate and doesn't fall apart until a great deal of power is being dumped into the driver.
T/S parameters are SMALL SIGNAL and they are surprisingly effective at predicting the SMALL SIGNAL performance metrics in enclosure types of all kinds.
My lesson from this thread so far, is that it is treacherous to used a bass-reflex design (or various other designs like that mis-named quarter-wavelength "horn") when they are based on having a stable driver resonance which works against the enclosure resonance (which is quite stable once constructed and the weather doesn't change).
To actually learn a lesson from anything posted here you would have to research the implications of the results. Have you simulated or measured the effects of using either of the sets of t/s parameters derived from the differing power levels?
You might find that within a certain window of measured power the t/s parameters shift in complimentary ways, resulting in a box model and simulated/measured performance that turns out to the be same even though the t/s parameters look significantly different.
Once a certain power threshold has been achieved you might find that the above does not hold true anymore, and that a larger box is required for drivers tested under very high power conditions. This is completely valid and makes sense - you are incorporating the power compression factor into the t/s parameters and it's completely obvious that a driver well into power compression is going to need a larger box to perform optimally.
The part about driver resonance working against enclosure resonance seems nonsensical and I have no idea what you are talking about. Everything works together. if you are talking about non linearity at a certain power or excursion level, this information is not included in the simulation but the behavior and effects of such are well known.
So the problem is not that the beloved T-S parameters aren't the complete description of driver behaviour, but that people sometimes think they are. Just a model that is good enough for purposes until you start sawing lumber to build a cabinet.
Ben
The actual problem is that you don't understand or care to learn about the data that is being presented. The rest of us are well aware that drivers are not linear at their limits, and we know what's going to happen when those limits are met and exceeded.
Your continued confirmation bias is getting you into trouble, it clearly points out that you don't understand the principles that are being discussed. You've clearly shown that you don't understand how even sealed boxes or stuffing works, that puts you on shaky ground when trying to understand how more complex enclosures and simulations work.
It is clear that you do understand that there are non linearities at high power and/or excursion levels but posts like this show that you are uninterested in learning about the difference between small signal and large signal performance, the effects of high power/excursion levels, the power threshold that these effects occur and how to predict how these effects will influence the results.
Confirmed. A lower compliance implies a higher Fs and Qts but a smaller Vas, so that the resonance in the box does not change significantly and the frequency response remains relatively linear, albeit with a higher cut-off.You might find that within a certain window of measured power the t/s parameters shift in complimentary ways, resulting in a box model and simulated/measured performance that turns out to the be same even though the t/s parameters look significantly different.
I doubt it. The woofer and port are tightly coupled in most conventional bass-reflex designs, for the distance between them is lower than the shortest quarter-wavelength of their mutual operation. The phase difference between their radiations is determined by frequency alone and is accounted for in the model, e.g. it is 90 degrees at the tuning frequency and approaches 180 degrees as the frequency decreases further.Mutual coupling, perhaps?Attached is the frequency response that I measured in this manner with the port tuned to 34 (yellow) and 38 Hz (green). The most amazing thing is the roll-off of about 32 db/oct. Whence may it come?
Last edited:
- Status
- Not open for further replies.
- Home
- Loudspeakers
- Subwoofers
- Small-signal parameters