Hi,
I have measured, designed and built an active crossover network for my DIY active loudspeakers.
The measured results deviate from the simulated results. First please have a look at the simulations and the actual measured results.
Regards,
Bill
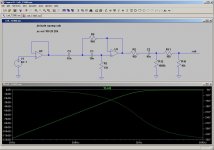
First, simulated high pass filter for the tweeter circuit.
I have measured, designed and built an active crossover network for my DIY active loudspeakers.
The measured results deviate from the simulated results. First please have a look at the simulations and the actual measured results.
Regards,
Bill
First, simulated high pass filter for the tweeter circuit.
Attachments
Last edited:

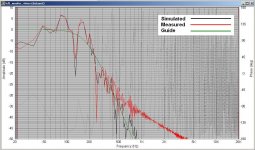
The measurements were made using SpeakerWorkshop, i.e. they are acoustic measurements. The microphone was not in the exact location as when the first raw driver measurements were made, so some small differences can be observed.
I understand that those are not high end equipments and the noise may be on the high side, but do not expect the noise to be as high as what you see from the graphs.
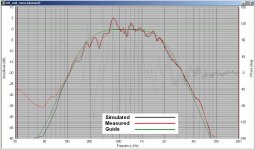
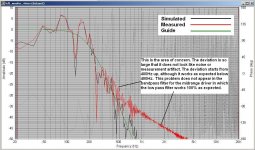
Especially worrying, the woofer response is far from what is simulated.
I also understand that ideal opamps were used in the simulations. I added a 75R to the output of the opamp to simulate output impedance and only see deviations from 200kHz, and it is -82dB, rather than from 400Hz -25dB.
I have been using opa627. For the woofer circuit, I replaced the opa627 with LM4562 with absolutely no measurable differences.
The input impedance on the positive side and negative side are not matched. But I do not expect they would cause the deviations as seen in the graphs.
What has gone wrong?
I understand that those are not high end equipments and the noise may be on the high side, but do not expect the noise to be as high as what you see from the graphs.
Especially worrying, the woofer response is far from what is simulated.
I also understand that ideal opamps were used in the simulations. I added a 75R to the output of the opamp to simulate output impedance and only see deviations from 200kHz, and it is -82dB, rather than from 400Hz -25dB.
I have been using opa627. For the woofer circuit, I replaced the opa627 with LM4562 with absolutely no measurable differences.
The input impedance on the positive side and negative side are not matched. But I do not expect they would cause the deviations as seen in the graphs.
What has gone wrong?
Attachments


Hi Bill ! It is funny to see how the drivers try to follow the ideal curve ,but they fail !!
Each on its own ,they add peaks and dips ...and those are only the frequency graphs .
My suggestion is to look at the system as a whole : you didn't tell us which amplifiers and which drivers in which enclosures you were using for the test ,which is meaningful by itself and appreciable ...but in a active multi-way system you can't blame only to the crossover .
Hi Bill ! It is funny to see how the drivers try to follow the ideal curve ,but they fail !!
Each on its own ,they add peaks and dips ...and those are only the frequency graphs .
My suggestion is to look at the system as a whole : you didn't tell us which amplifiers and which drivers in which enclosures you were using for the test ,which is meaningful by itself and appreciable ...but in a active multi-way system you can't blame only to the crossover .
The peaks and dips are due to comb filters of boundary effect as I was using a 44ms gate in the "in-position" measurements. However, the absolute values are are unimportant, the comparison values are.
All power amps use identical circuit boards and are constructed in the same way with response well into 50k and above with little errors within the audioband.
The devils must be in the line level crossover circuits posted in above.
1) The tweeter response rises at the stop band. This looks like a measurement artifact to me.
2) The midrange also rises at the stop band on the low end. At -30dB it does not look like noise but may also be measurement artifact.
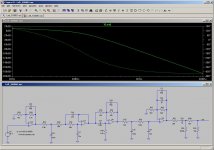
3) The woofer circuit obviously has errors. The problem does not appear to be noise because on the midrange graphs the stop band response at the top end works as simulated right down to -50dB and below. Earlier I found this problem and redesigned and rebuilt the circuit board. But I got the same measurement result so it is not possible to have wrong connection or cold solder joints, etc. I also compared the left channel to the right channel and they showed the same things.
In summary, I guess the high pass circuits may not have a problem. The problems shown with them would probably be measurement artifacts, due to noise or measurement equipment errors. However, the low pass section of the woofer circuit looks very suspicious.
Does Shallen key have problems with low pass filters rather than high pass filters?
Last edited:
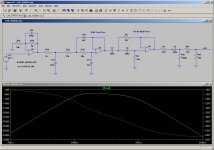
Sorry but I can only put very subjective documentation ,and I am very noob in electronics... but the only thing I recognize in the woofer section ,is a 3rd order lowpass...
maybe the Bessel kind of ripple produces some notch distortion ,accentuated by the op-amp internal construction and feedback implementation . BTW what are functions of the other op-amps in that circuit ?
maybe the Bessel kind of ripple produces some notch distortion ,accentuated by the op-amp internal construction and feedback implementation . BTW what are functions of the other op-amps in that circuit ?
This is a pretty roundabout way of doing electrical measurements on the crossover outs. I'm getting the impression you've not characterized the acoustic noise floor, controlled for room modes, or accounted for SPL variations in driver output---measuring ambient noise, doing 2 and 4 pi outdoor measurements, and taking a look at the driver datasheets should clear most of that up. Or just make life easy on yourself and do electrical measurements to validate the crossover.
That said, the tweeter stopband glitches at 1 and 1.5kHz are a bit odd. Diffraction issues? Depending on how the amps interact with the drivers you may see a couple dB there too. Also, it's Sallen-Key
That said, the tweeter stopband glitches at 1 and 1.5kHz are a bit odd. Diffraction issues? Depending on how the amps interact with the drivers you may see a couple dB there too. Also, it's Sallen-Key
It would take a bit of effort to do electrical measurements so I thought using the existing acoustic measurement would be a short cut. Drivers were measured, then electrical filters applied, then remeasured in the same location using exactly the same method and setting, and the results displayed in the above posts. As you can see from the individual and summed responses that the filters work mostly as expected, except with some artifacts on the low end of the stop bands of the tweeter and midrange, and noticeably the high end of the stop band of the woofer, the last of which may probably be caused by the "behaviour" of the opamps in a Shallen key, or defected parts. I am pretty sure you can forget about room modes, etc, under this particular context. I hope experts can point out what causes the failure of the LP filter in the woofer circuit - noise? defected capacitors? opamp output impedance? opamp input capacitance distortion? oscillation (if it happens it must be the last opamp)? Insufficient gain (if it happens it must be the last opamp)?
Last edited:
So the "simulated" curves are the all pass driver data multiplied by the guide curve and the "measured" curves are the measurements with the crossover in place and you're concerned about the difference between them? That makes the tweeter stop band extra weird but with respect to the woofer deep nulls are rarely very stable and 250Hz is a fairly common frequency for floor reflections, if a bit on the low side. Did you try remeasuring, moving the mic a few centimeters, or (if the floor's not carpeted) putting an absorber at the first reflection possition? I'm interpreting post 7 to mean the mic's not in the same place between the two sets of data.
Are you sure the tail above 500Hz isn't just the ambient noise floor?
Are you sure the tail above 500Hz isn't just the ambient noise floor?
Last edited:
You could repeat the simulation of the Sallen-Key filters accounting for component tolerances. A 1 % 10k resistor can be anything between 9k9 and 10k1. The capacitors depend on the type. 10n in NP0 can be 9n95 up to 10n05, in X7R it can be 9n9 up to 10n1, as film caps it can be 9n8 up to 10n2, etc. When you are done with that account for temperature coefficients, too, then for component, lead and trace parasitics. Also add the measuring error to the mix. When you are done, you will find two worst case extremes und your real-life measurements will probably fall in between them.
Have you deliberating adopted unusual Q values for the unity gain S&K filters?
It's normal to choose Butterworth (Q=0.71) or Linkwitz Reilly (Q=0.5), but your Qs are all over the region.
It's normal to choose Butterworth (Q=0.71) or Linkwitz Reilly (Q=0.5), but your Qs are all over the region.
You could repeat the simulation of the Sallen-Key filters accounting for component tolerances. A 1 % 10k resistor can be anything between 9k9 and 10k1. The capacitors depend on the type. 10n in NP0 can be 9n95 up to 10n05, in X7R it can be 9n9 up to 10n1, as film caps it can be 9n8 up to 10n2, etc. When you are done with that account for temperature coefficients, too, then for component, lead and trace parasitics. Also add the measuring error to the mix. When you are done, you will find two worst case extremes und your real-life measurements will probably fall in between them.
This is the area I have been thinking about. I use 1% resistors, and usually 1% capacitors, or measured within 2%. Only MKP capacitors are used. These components should not run hot. I sometimes wonder if overheating during soldering would cause damage to the MKP capacitors. I found overheating can damage to small polystyrene capacitors easily.
Trace parasitics can be bad using dot-matrix board but I have no other choices at the moment. This is the area that I suspect that would increase the input capacitance of the opamp dramatically. How bad that is, I don't know, so I am here to ask for expert opinions. I would not think that it could cause as much deviation as what is shown in the LP filter of the woofer circuit.
Last edited:
Have you deliberating adopted unusual Q values for the unity gain S&K filters?
It's normal to choose Butterworth (Q=0.71) or Linkwitz Reilly (Q=0.5), but your Qs are all over the region.
Andrew,
That is a very good question.
Because the opamp has a finite output impedance, the feedback capacitor would "leak" high frequency into the output, as I have simulated in this post: http://www.diyaudio.com/forums/chip...ortion-simulated-vs-measured.html#post2403865
Therefore, in the low pass section, in order to "completely" block some high frequency beyond 200kHz, I have a cascode of first order low pass filters, which have a low Q.
Consequently, the Q of the Shallen Key is slightly above Butterworth 0.707 and is toward a Chebyshev filter, in order to achieve the overall Q desired to shape the woofer response.
There have been articles indicating that opamp implementation of low Q Shallen key filters has relative low distortion, but distortion can go over the roof for high Q Chesbyshev filter implemented with Shallen key. I don't have the details and would like to find out more. If anybody knows the sources please post here. I guess this only applies to low pass filters, not high pass filters.
But then, this may not answer the question why the woofer low pass filter deviates so much from the simulated curve.
I start to think it may be just an measurement artifact due to the use of lower quality measurement equipments.
Regards,
Bill
I think you are making a mountain out of a mole hill. That filter looks like it is performing as designed and you can safely ignore the 'error' beyond 400hz.
Try running the measurement again at a higher output volume. Have a look at the result with some smoothing applied.
Try running the measurement again at a higher output volume. Have a look at the result with some smoothing applied.
Last edited:
- Status
- Not open for further replies.
- Home
- Amplifiers
- Chip Amps
- Sallen Key distortion? - simulated vs measured