Jan
His ringing like a bell is at 60, 120, 180 etc hertz.
Also looks like it is not an instrumentation high impedance differential input.
The test signal null looks quite stable.
There is mass confusion here, maybe you can sort it out. First of all the machine is auto scaling making taking readings difficult and the windowing used is making exact amplitudes of the peaks ambiguous. I assume the bell referred to is the shape in the last plot I have no idea how that has anything to do with ringing. Didn't your article have some pictures, I remember them as being fairly clean unlike the wire distortion pics?
Last edited:
There is mass confusion here, maybe you can sort it out. First of all the machine is auto scaling making taking readings difficult and the windowing used is making exact amplitudes of the peaks ambiguous. I assume the bell referred to is the shape in the last plot I have no idea how that has anything to do with ringing. Didn't your article have some pictures, I remember them as being fairly clean unlike the wire distortion pics?
Yes I used balanced drive and differential analyzer inputs in a shielded case. But give the newbie credit he is beginning to actually do something.
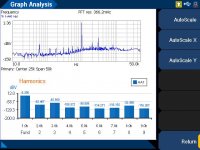
I suspect the third plot is 2H vs F. But it is not clear.
As he is doing work, he now gets a discount from me.
There is mass confusion here, maybe you can sort it out. First of all the machine is auto scaling making taking readings difficult and the windowing used is making exact amplitudes of the peaks ambiguous. I assume the bell referred to is the shape in the last plot I have no idea how that has anything to do with ringing. Didn't your article have some pictures, I remember them as being fairly clean unlike the wire distortion pics?
@Ed: Yes I was referring to that bell shape frequentcy response.
Jan
I am not used to being the FNG
Ed,
Thanks for the line of credit and the discount. I am not used to being the FNG, it has been a long time. I am full of anticipation.
I was good this year; Santa brought me a new audio analyzer. I hope that Santa has differential cables to match the XLR’s on the Keysight instrument. For the meantime BNC cables with mini grabbers will have to do. I do have my eye on a cookie tin to shield things.
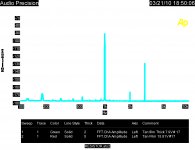
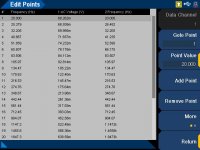
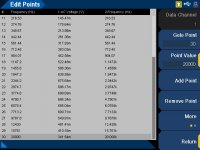
The frequency sweep is interesting to me. See the attachments below; they are screen shots of the data points of the frequency sweep. To illustrate here are a couple of (X, Y) data points to illustrate. The plot starts with (Y= frequency hz. , X= voltage at the bridge output); (20hz., 68.262m), (25.379hz., 68.93m)……… (20000hz, 341.54m).
Keeping the input voltage constant, the bridge output voltage varies with frequency. Connecting the data points the curve is the shape of a bell.
Jan all the data points are in the attachments.
DT
Yes I used balanced drive and differential analyzer inputs in a shielded case. But give the newbie credit he is beginning to actually do something.
I suspect the third plot is 2H vs F. But it is not clear.
As he is doing work, he now gets a discount from me.
Ed,
Thanks for the line of credit and the discount. I am not used to being the FNG, it has been a long time. I am full of anticipation.
I was good this year; Santa brought me a new audio analyzer. I hope that Santa has differential cables to match the XLR’s on the Keysight instrument. For the meantime BNC cables with mini grabbers will have to do. I do have my eye on a cookie tin to shield things.
The frequency sweep is interesting to me. See the attachments below; they are screen shots of the data points of the frequency sweep. To illustrate here are a couple of (X, Y) data points to illustrate. The plot starts with (Y= frequency hz. , X= voltage at the bridge output); (20hz., 68.262m), (25.379hz., 68.93m)……… (20000hz, 341.54m).
Keeping the input voltage constant, the bridge output voltage varies with frequency. Connecting the data points the curve is the shape of a bell.
Jan all the data points are in the attachments.
DT
Attachments

Keysight uses direct digital synthesis to create the test signal. This gives 110 dB of clean signal range. So on your straight resistor measurements all of the results are more than 110 dB down from the generator's output level. So as you first asked for a plot of the system performance that would be applicable here.
Now as to output amplitude shift, I'll actually have to take a look. But you might want to monitor your generator output with a second channel to confirm it really is flat.
Now if you drop the test frequency to 50 hertz you should be able to get better data on distortion components as they should rise. Then you can compare the harmonic structure to what you are measuring at higher frequencies.
Last edited:
These audio analyzers were not designed or built to measure the parametrics of resistors. My quest is to start with something simple and work my way up from there. The resistor is my first victim.
I tested a range of values of resistors both in the balanced circuit and straight up resistors having the same ohm value as the combined bridge. Yes the lower value resistors challenge the voltage regulation of the function generator. The voltage does begin to sag. For the sweep function previously posted, the resistors used were Dale RN60E2673C’s (267k ohms). These resistors measured straight up (not the bridge) with the function generator output set at 4 volts the sweep test shows 3.97ish volts 100 to 20,000hz across the resistor. I do not know what is happing with supply voltage in the bridge sweep test. The supply voltage may be interacting with all the strange stuff going with the bridge output voltage.
Ed, I like your idea of monitoring the function generator output voltage with another analyzer channel. The idea occurs to me to place a sensing resistor in series with the bridge test circuit. The sensing resistor selected, 1, 10 or 100 ohms, 0.1% whatever value works best. The second channel will sense the voltage / current behavior of the test bridge and function generator.
DT
Attachments
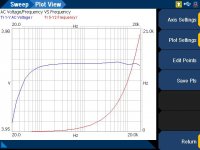
It would be very interesting to see that a straight resistive divider did not have flat frequency response in the audio band.
Jan all the data points are in the attachments.
DT
Yes but I would need them as an actual file, txt or csv or something I can open in Notepad or Excel. But since you seem to have discovered the proper way to graph it, probably not need my help. Though my graphs would be nicer and easier to use in Word or similar documents. Want to do a trial run? Probably the 'Save Pts' menu item.
Jan
Well,
I used 10 1K 1/4W cheapie metal film resistors in a 4/1 1/4 bridge. Input was 8 volts. At 40 Hz I had 6.8 millivolts out. it smoothly declined to 3 millivolts at 20,000 Hz.
I used a benchtop signal generator a balancing transformer and measured with a Fluke 85 DVM.
So at low frequencies where the distortion would be higher there was a slight lift. No sign of a bell shaped curve.
You might want to go simple to see what you get.
New Audio Note Silver Tantalums, only £29 each!
Audio Note Silver Tantalum Non-Magnetic Resistors | Hifi Collective

Audio Note Silver Tantalum Non-Magnetic Resistors | Hifi Collective
New Audio Note Silver Tantalums, only £29 each!
Audio Note Silver Tantalum Non-Magnetic Resistors | Hifi Collective
buy a couple to see how they sound!
The write up is hilarious, they got the termination failure rate down to 15-20% so they had a product. 🙄 Heaven forbid you dress the leads more than once, does that get you another 15% fails.
New Audio Note Silver Tantalums, only £29 each!
Audio Note Silver Tantalum Non-Magnetic Resistors | Hifi Collective
I can hardly contain my enthusiasm. Well maybe if I try... There now it is contained.
It would be interesting to see some empirical proof that they are any better in a circuit than other 1% resistors costing a fraction of the price, I'm also interested in what effect a small bit of ferromagnetism would have on the circuit!
But then these are fashion components designed to sell to believers in this sort of thing....
🙂
But then these are fashion components designed to sell to believers in this sort of thing....
🙂
I couldn't find a data sheet, and had to dig to find anything out... The failure rate is interesting, not going to be used for any critical designs anywhere MTBF figures would be worrying...
Audiophile bling component🙂
Audiophile bling component🙂
I have used the basic AN tantalums 2.80£ in place of dale , I cannot detect difference... if you want test tantalum try shinkoh
BTW AN UK output iron is quite good
BTW AN UK output iron is quite good
New Audio Note Silver Tantalums, only £29 each!
Audio Note Silver Tantalum Non-Magnetic Resistors | Hifi Collective
Let's see...In my present Bi-amped system there are 53 resistors per channel for the active crossovers and amps for a total of 106. 106 X $43.21 = $4580.26. 😱 What a BARGAIN! Now where's my bank card, I NEED SOME...🙄
Whoops, I better buy extras to cover for the ones with failed end caps...
Mike
Last edited:

It would be interesting to see some empirical proof that they are any better in a circuit than other 1% resistors costing a fraction of the price
🙂
On second look they are banded as 1% but use the 10% standard values so they won't drop in for any 1% resistor brand except at a sparse set of values. They even left out 2.7x and 5.6x leaving large gaps with no choices.
Last edited:
- Status
- Not open for further replies.
- Home
- Member Areas
- The Lounge
- Resistor Sound Quality?