It seems like they haven't sunk in, yet.
There is nothing wrong with people enjoying listening to Vinyl, however flawed it might be. 'Enjoyment' is the key word. There is only a small % who claim a superiority, but they are generally harmless.
This is after all a hobby site where people discuss a hobby.
There is nothing wrong with people enjoying listening to Vinyl, however flawed it might be. 'Enjoyment' is the key word.
Agreed, but this enjoyment has some implications along the lines that maybe the ears really are as insensitive as the psychoacoustics people say.
So? You'll find the majority here accept that. With DIY expectation bias works to one's advantage. You built it so it sounds great. Everyone is happy.
I think 'two or more' would suffice and it is a bit of a nit to pick on this relatively small bit of sloppiness.
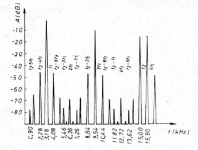
Just remembered: I found the original of that graph that JC used, way back when, with missing legends, to proof un/an/aharmonics.
Jan
Attachments
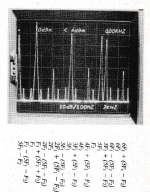
I tried the same test again few days ago with one of my power amplifiers, all I get are the artifacts of the measurement method 🙂
And in a very very different level than those 2WW measurements 😉
What's worst, the circuit uses opamp and has global feedback!! 😀
And in a very very different level than those 2WW measurements 😉
What's worst, the circuit uses opamp and has global feedback!! 😀
Attachments
Just remembered: I found the original of that graph that JC used, way back when, with missing legends, to proof un/an/aharmonics.
Jan
Please don't remind me, two of us blew that up to enough pixels to compute the unlabeled ones which of course were even more A*f1 +- B*f2 (I think it was andyc).
Agreed, but this enjoyment has some implications along the lines that maybe the ears really are as insensitive as the psychoacoustics people say.
I don't follow that reasoning, unless it comes from the camp "once you recognize the flaws of vinyl you can't go back to it". I listen to vinyl regularly on a very ordinary setup and quite enjoy it. I heard through the grapevine that a similar set up was at RMAF ($1000 budget) and at least a couple of listeners enjoyed it nearly or as much as a couple of the ~$100K setups.
I don't follow that reasoning, unless it comes from the camp "once you recognize the flaws of vinyl you can't go back to it". I listen to vinyl regularly on a very ordinary setup and quite enjoy it. I heard through the grapevine that a similar set up was at RMAF ($1000 budget) and at least a couple of listeners enjoyed it nearly or as much as a couple of the ~$100K setups.
Human memory is merciful and when I wrote that post I wasn't thinking negative thoughts about vinyl at all.
For my first 30 or more years as an audiophile, analog media was all we had, and vinyl was the mainstream media. Clicks and pops aside, really good LPs really weren't all that bad.
As bad as the LP format measures, it could be really pretty good to listen to. And, if you transcribe a really good LP, take out the tics and pops, and you don't listen too hard, it might sound about as good as a good CD.
Psychoacoustics suggests an overall threshold of perception that is not too far from the measured performance of vinyl on the best day of its life.
There was a little more than 100 years of development of vinyl. While its audible flaws had been reduced to practically irreducible levels, it is possible that they had been pushed into the most psychoacoustically inconspicuous corners.
Human memory is merciful and when I wrote that post I wasn't thinking negative thoughts about vinyl at all.
For my first 30 or more years as an audiophile, analog media was all we had, and vinyl was the mainstream media. Clicks and pops aside, really good LPs really weren't all that bad.
As bad as the LP format measures, it could be really pretty good to listen to. And, if you transcribe a really good LP, take out the tics and pops, and you don't listen too hard, it might sound about as good as a good CD.
I can fully agree to that. But...
Psychoacoustics suggests an overall threshold of perception that is not too far from the measured performance of vinyl on the best day of its life.
... not to this. It is not that we don't hear the shortcomings of vinyl - or at least I do. But I (and I suspect a lot of others) enjoy it despite it's shortcomings. Vinyl has a lot of attractions that go above just the reproduction of sound.
A lot has to do with cultural factors and the rituals - it's not accidental that people typically play records at the end of a busy day or on a quiet Sunday morning.
I can recommend to read Mike Uwins' Analog Hearts, Digital Minds article about his very smart controlled test of records versus CD - his findings, in a nutshell, were that if people had no knowledge what they were listening to, they favored digital. Also the LP aficionados. However, when 'the ritual' was executed, they favoured what they thought was vinyl independent of whether it actually was vinyl or digital.
One of the best studies about this I know of: http://linearaudio.net/volumes/2235
Or if you are phosophically inclined, read Vinyl – The Analog Record in a Digital Age
Also at http://linearaudio.net/volumes/2235
Yet more? The Ins and Outs of turntable dynamics - and how they mess up your vinyl playback
Also at http://linearaudio.net/volumes/2235
Jan
Last edited:
Rings like a bell curve.
An “ideal” textbook resistor is ohmic, as in it follows Ohm’s law to the letter. No component, even the basic resistor is “ideal” particularly when we are attempting to measure down to PPM.
The balanced resistor test circuit proposed by simon7000 is problematic. A balanced Wheatstone bridge is based on nulling or balancing the bridge such that there is zero differential voltage at the output at the fundamental test frequency. None of the published Ap outputs show the test circuits nulled at the test frequency. Even with carefully selected 0.1% resistors there is a FFT H1 peak at the fundamental test frequency. To the degree that the resistors are matched there is an attenuation of the H1 or fundamental test frequency. There is still a H1 fundamental peak. Keep in mind that the Audio Analyzer and balanced circuit are sensitive to the level of Parts Per Million.
Also keeping in mind that there are no perfect ohmic resistors, there may be some thermal variations of resistance. There may be some frequency variation of impedance due stray inductance and or capacitance. It turns out even with carefully selected resistors the balanced resistor test bridge is sensitive to the extreme with varying test frequencies. In fact this proposed balanced resistor test bridge rings like a bell curve.
I will post a couple of sample audio analyzer frequency sweeps to document this. I need to get the plots out of the U8903B into the PC to post.
DT
...or you plunk a few $ and download the article right away. You've choices! ��
Ja
An “ideal” textbook resistor is ohmic, as in it follows Ohm’s law to the letter. No component, even the basic resistor is “ideal” particularly when we are attempting to measure down to PPM.
The balanced resistor test circuit proposed by simon7000 is problematic. A balanced Wheatstone bridge is based on nulling or balancing the bridge such that there is zero differential voltage at the output at the fundamental test frequency. None of the published Ap outputs show the test circuits nulled at the test frequency. Even with carefully selected 0.1% resistors there is a FFT H1 peak at the fundamental test frequency. To the degree that the resistors are matched there is an attenuation of the H1 or fundamental test frequency. There is still a H1 fundamental peak. Keep in mind that the Audio Analyzer and balanced circuit are sensitive to the level of Parts Per Million.
Also keeping in mind that there are no perfect ohmic resistors, there may be some thermal variations of resistance. There may be some frequency variation of impedance due stray inductance and or capacitance. It turns out even with carefully selected resistors the balanced resistor test bridge is sensitive to the extreme with varying test frequencies. In fact this proposed balanced resistor test bridge rings like a bell curve.
I will post a couple of sample audio analyzer frequency sweeps to document this. I need to get the plots out of the U8903B into the PC to post.
DT
Last edited:
It turns out even with carefully selected resistors the balanced resistor test bridge is sensitive to the extreme with varying test frequencies. In fact this proposed balanced resistor test bridge rings like a bell curve.
I'll wait for your pics but I and many others have used passive nulling often by bridge to enhance net dynamic range, H1 leakage is almost irrelevant after a certain point. Your comment about about imperfect null (H1 leakage) shows a fundamental misunderstanding of whats trying to be accomplished. At audio frequencies with ordinary components I have never experienced "ringing like a bell" unless the build was pathological.
Last edited:
I will post a couple of sample audio analyzer frequency sweeps to document this. I need to get the plots out of the U8903B into the PC to post.
DT
If you can export the data file I can generate plots for you.
Jan
Cognitive Processor
Jan,
Thanks for the offer.
I have been playing with this Keysight machine for a couple of days. The “Menu” Has selections for “Standard”, “Test Sequence Application” and “8903B” (the legacy format) options.
All the FFT graphs and Frequency sweeps done so far are one off “standard” tests, and apparently saved in some strange XML file format that is not cooperating with my efforts to export. The Test Sequence Application format is apparently a batch process with a formatted Word document report. I am sorting out the bugs in my cognitive processor. When I get this sorted out in a few days I will post one of those Keysight formatted Word documents.
The one off tests have an option to output data files in a comma separated file format for Excel. I called Keysight for assistance; they cannot get this file format to work for them either. It will be good to post the data as well when this gets sorted out.
DT
If you can export the data file I can generate plots for you.
Jan
Jan,
Thanks for the offer.
I have been playing with this Keysight machine for a couple of days. The “Menu” Has selections for “Standard”, “Test Sequence Application” and “8903B” (the legacy format) options.
All the FFT graphs and Frequency sweeps done so far are one off “standard” tests, and apparently saved in some strange XML file format that is not cooperating with my efforts to export. The Test Sequence Application format is apparently a batch process with a formatted Word document report. I am sorting out the bugs in my cognitive processor. When I get this sorted out in a few days I will post one of those Keysight formatted Word documents.
The one off tests have an option to output data files in a comma separated file format for Excel. I called Keysight for assistance; they cannot get this file format to work for them either. It will be good to post the data as well when this gets sorted out.
DT
Better late than never
Hello,
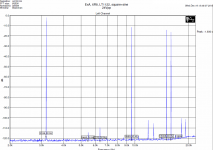
Better late than never, I was ready to call it quits for the day and tried one more thing, [Shift] + [Print] keys and there were magic jpeg images right there on the thumb drive.
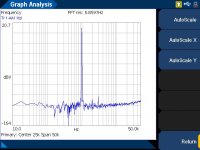
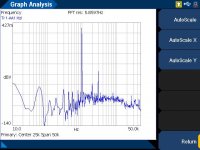
All the test were done with 4 volt 1000 hz on the frequency generator. Graph_s shows plenty of resolution in the harmonics without the convolution of the bridge test circuit (two resistors in series for equal delta v across all the test resistors). Graph_b is the bridge test circuit. The two FFT graphs are quite different including the harmonics, big differences between the harmonic series, (disadvantage goes to the bridge test circuit). The sweep plot shows the bridge test circuit ringing like a bell curve. (I am guessing that the null is shifting with the modulated test frequency). Several resistor ohm values were tested in the bridge test circuit, they all showed the ringing thing. The lower ohm value resistors had higher frequency peaking curves.
DT
Hello,
Better late than never, I was ready to call it quits for the day and tried one more thing, [Shift] + [Print] keys and there were magic jpeg images right there on the thumb drive.
All the test were done with 4 volt 1000 hz on the frequency generator. Graph_s shows plenty of resolution in the harmonics without the convolution of the bridge test circuit (two resistors in series for equal delta v across all the test resistors). Graph_b is the bridge test circuit. The two FFT graphs are quite different including the harmonics, big differences between the harmonic series, (disadvantage goes to the bridge test circuit). The sweep plot shows the bridge test circuit ringing like a bell curve. (I am guessing that the null is shifting with the modulated test frequency). Several resistor ohm values were tested in the bridge test circuit, they all showed the ringing thing. The lower ohm value resistors had higher frequency peaking curves.
DT
Attachments

Last edited:
Jan,
Thanks for the offer.
I have been playing with this Keysight machine for a couple of days. The “Menu” Has selections for “Standard”, “Test Sequence Application” and “8903B” (the legacy format) options.
All the FFT graphs and Frequency sweeps done so far are one off “standard” tests, and apparently saved in some strange XML file format that is not cooperating with my efforts to export. The Test Sequence Application format is apparently a batch process with a formatted Word document report. I am sorting out the bugs in my cognitive processor. When I get this sorted out in a few days I will post one of those Keysight formatted Word documents.
The one off tests have an option to output data files in a comma separated file format for Excel. I called Keysight for assistance; they cannot get this file format to work for them either. It will be good to post the data as well when this gets sorted out.
DT
Yes the CSV data would be what I need.
Jan
Hello,
Better late than never, I was ready to call it quits for the day and tried one more thing, [Shift] + [Print] keys and there were magic jpeg images right there on the thumb drive.
All the test were done with 4 volt 1000 hz on the frequency generator. Graph_s shows plenty of resolution in the harmonics without the convolution of the bridge test circuit (two resistors in series for equal delta v across all the test resistors). Graph_b is the bridge test circuit. The two FFT graphs are quite different including the harmonics, big differences between the harmonic series, (disadvantage goes to the bridge test circuit). The sweep plot shows the bridge test circuit ringing like a bell curve. (I am guessing that the null is shifting with the modulated test frequency). Several resistor ohm values were tested in the bridge test circuit, they all showed the ringing thing. The lower ohm value resistors had higher frequency peaking curves.
DT
Did you also balance the bridge capacitively? Normally you'd have a trimmer cap in one of the legs to make the bridge balance flat with frequency.
Or you test at a specific (low) frequency where the parasitic capacity is below the resolution.
Jan
it's not accidental that people typically play records at the end of a busy day or on a quiet Sunday morning.
On your weakest hour and moment.
(Same principle/phenomenon applies to many other areas, various examples can be pulled out of thin air. Mmm, what happened to me, evolution ?)
Did you also balance the bridge capacitively? Normally you'd have a trimmer cap in one of the legs to make the bridge balance flat with frequency.
Or you test at a specific (low) frequency where the parasitic capacity is below the resolution.
Jan
Jan
His ringing like a bell is at 60, 120, 180 etc hertz.
Also looks like it is not an instrumentation high impedance differential input.
The test signal null looks quite stable.
- Status
- Not open for further replies.
- Home
- Member Areas
- The Lounge
- Resistor Sound Quality?