Ed, I thought that I made a useful suggestion considering the manufacturers own admitted problem, as to sound really that issue has gotten just too boring.
I prefer 100% grass-fed beef lean, mean, and strong tasting. Beef for toothless billionaires has no interest to me.
Scott,
You did make a very insightful and valuable suggest. Sorry things got confused by including two different topics in one post.
As to your preferred meat, again we ain't arguing. But you did mention a bit back the price if wagyu. So I thought it amusing to see the local burger joint serving it. Don't actually like them too much way too cutsie menu.
Does it mean Riken is a serial killer, I mean sounding dead good in serie ?
I was surprised to hear difference for a so low value than 110 ohms in serie between an AB carbon comp and a carbon takman after the opamp buffer ! I thought it was not possible with so weak value ! Maybe Something else changed between the two listening sessions !
I was surprised to hear difference for a so low value than 110 ohms in serie between an AB carbon comp and a carbon takman after the opamp buffer ! I thought it was not possible with so weak value ! Maybe Something else changed between the two listening sessions !
not only Ohm’s Law
Yes I did separate the Function Generator and Meter, no noted difference.
Recall that I previously noted that this frequency bell curve shifts to the left and reaches greater voltages with higher R values. See the attached PDF. I ran the same frequency sweep as before there is a distinct bell curve. This time with Dale 1% 100K ohm resistors making up the bridge.
It is not only Ohm’s Law at work here.
DT
I suspect if you move the meter farther away from the signal generator the readings in bridge mode will change.
Yes I did separate the Function Generator and Meter, no noted difference.
Recall that I previously noted that this frequency bell curve shifts to the left and reaches greater voltages with higher R values. See the attached PDF. I ran the same frequency sweep as before there is a distinct bell curve. This time with Dale 1% 100K ohm resistors making up the bridge.
It is not only Ohm’s Law at work here.
DT
Attachments
why are you interested ? please just ship post like thisWhat are they supposed to do to Sound?
Do they actually need to be soldered to something or is it enough to place them within, say, 6 inches from the DAC?
Shouldn't you also need to replace the other, say, 2000 resistors involved in the audio path from microphone to speaker?
Or at least the , say, 50 or 100 regular resistors present inside the DAC?
Hello Erland.Thanks i will be careful 🙂 I do not like the Brass/copper version.
What is it that you not enjoy/like about the Brass/copper version.
You are buying the silver version of the Tantalum resistor.
Is there a particular/signature sound of the tantalums that draws you back ?.
Dan.
Just ordered 2 x 220 ohm Audio Note tantalium resistors. Unmagnetic 2 w with silver endcaps and silver leadouts. Very exspensive 73 pund for 2. Looking forward to place them at the output of my dac.
Where exactly on the output of your DAC?
in resistors.
Have a serious back tick (or was that kick back, not sure)
Yes I did separate the Function Generator and Meter, no noted difference.
Recall that I previously noted that this frequency bell curve shifts to the left and reaches greater voltages with higher R values. See the attached PDF. I ran the same frequency sweep as before there is a distinct bell curve. This time with Dale 1% 100K ohm resistors making up the bridge.
It is not only Ohm’s Law at work here.
DT
What I was looking for is two tests one with the gear close to each other and then much more seperation. If the gear has three prong AC power cords, it would also be interesting to try an isolation transformer on one or failing that a ground lift.
From the test setup. 1.54525 volts into 1,000 ohms =1.54525 mA
1.54525 volts - .057902 delta = 1.48733 Volts
1.48733 volts / 1.54525 mA = 962.52 Ohms
1000 Ohms in parallel with 25,679 Ohms = 962.52 Ohms
At 100,000 Hertz 1/(6.28 x 100,000 x 25679) = 62 pF (Not quite right due to reactance combination but close enough.)
62 pF is about 2 feet of parallel wire.
Now are you using coaxial cable with the shields near each other for the test leads? Is there test equipment chassis coupling?
So I thought it amusing to see the local burger joint serving it. Don't actually like them too much way too cutsie menu.
OK I see, that's not that uncommon the prices vary enormously. The stuff at $39 an ounce is from Kobe itself one of the higher numerical grades and possibly even genetically traceable to its ancestors.
My personal best "steak house" experience
All the Tajima cattle are the descendants of "Tajiri-go" raised by Mr. Matsuzo Tajiri in Ojiro, Kami Town in Tajima, northern part of Hyogo Prefecture.
LCR tuned circuit?
I see that bell curve and I am thinking resonance, as in LCR tuned circuit. As you are, I am thinking where is the inductance and capacitance lurking? I have a short pair of separate leads with micro clips to connect to the Function Generator. As far as ground loop goes the Digital volt meter manual says that it is isolated.
I will be out for the holiday, back in a few days!
I will play with all this and see if anything changes.
DT
From the test setup. 1.54525 volts into 1,000 ohms =1.54525 mA
1.54525 volts - .057902 delta = 1.48733 Volts
1.48733 volts / 1.54525 mA = 962.52 Ohms
1000 Ohms in parallel with 25,679 Ohms = 962.52 Ohms
At 100,000 Hertz 1/(6.28 x 100,000 x 25679) = 62 pF (Not quite right due to reactance combination but close enough.)
62 pF is about 2 feet of parallel wire.
Now are you using coaxial cable with the shields near each other for the test leads? Is there test equipment chassis coupling?
I see that bell curve and I am thinking resonance, as in LCR tuned circuit. As you are, I am thinking where is the inductance and capacitance lurking? I have a short pair of separate leads with micro clips to connect to the Function Generator. As far as ground loop goes the Digital volt meter manual says that it is isolated.
I will be out for the holiday, back in a few days!
I will play with all this and see if anything changes.
DT
real world noise
Hello All,
After a couple of days away for the holiday I returned today to pickup my mail. There was a brown package with Volume 1 of Linear Audio inside. I read several interesting articles. Linear Audio uses a format I do not recall seeing before. It is printed as a small book and has articles like a magazine. There are lots of really nice figures, tables and graphic plots throughout.
Figure 19 in Scott Wurcer’s article caught my attention. Scott shows dramatic reduction of 2nd harmonic distortion with JFET bias adjustment. From a real life and real circuits point of view Scott shows all the real world noise in the baseline of this pair of FFT plots. Hats off to Scott.
Hats off to Jan Didden and Linear Audio.
DT
We try.
Thanks guys! L|A is a labor of love from the publisher as well as the crew of fantastic authors. I'm privileged to work with so many smart and kind persons.
And, I get to read all articles first 😉
Jan
And, I get to read all articles first 😉
Jan
Self Resonate Frequency peaks
DIY,
I believe that I am getting my head around this resistor in a bridge voltage drop thing.
Here is a list of the measurement process:
Using an audio analyzer voltage sweep across a 4 resistor bridge circuit with an increase in frequency I saw a bell shape increase, peak and fall in voltage across the bridge. For the frequency sweep each resistor of the 4 was the same value. The higher the resistor value the lower the frequency of the voltage peak.
2 of the same resistors were placed in series and the voltage of the lower resistor was measured using the same frequency sweep. A similar effect was observed without the differential null of the bridge circuit.
The frequency sweep was repeated measuring the voltage across each of the bottom two resistors of the original 4 resistor bridge. The plotted cuves of each resistor voltage were much the same however one curve subtracted from the other did not match the plot of the original frequency sweep measured across the bridge.
I repeated the frequency sweep this time using more tedious, manual, more basic frequency generator and 6 ½ digit voltage meter yielding much the same results.
If the parameter being measured was purely resistance we would expect to see test points that line up in a straight line, they do not. We would expect to see a null across the frequency sweep of the 4 resistor bridge, we do not.
Over the last holiday I downloaded “Keysight Technologies, Impedance Measurement Handbook”.
Chapter 1 page 06 Figure 1-9 shows plots of the effect of capacitive and inductive parasitics. I am beginning to think that the frequency sweep plots with the “bell curves” posted earlier in this thread are Self Resonate Frequency peaks. Later in the handbook it mentions that LCR component and network instruments can and should be corrected for stray inductance and capacitance in the test leads. The audio analyzer and 6 ½ digit volt meter do not have this ability.
Next step is to repeat the frequency sweep and FFT with the oscilloscope.
DT
Hi DualTriode,
Actually, an impedance analyzer is the correct tool, or a network analyzer. Something like a 4195A can correct for the L,C & R of the leads. The leads must be very similar to the factory accessory in order for the analyzer to cope with the impedance variations. High frequency sweeps are done with a test fixture connected right at the terminals.
Even a spot frequency tester can null it's test leads, like a 4263A. At the highest frequency range (100 KHz on that one) the test fixture must be used right at the test terminals of the instrument.
-Chris
What do you think?
Hello Chris,
Thanks for the insights regarding the instruments that have the ability to null the probes. Since this thread is in the lounge I will share a little.
I teach hydronics at a trade school (mechanical engineering, pumps, boilers - heating and cooling stuff). Much of my interest in this electrical / electronic stuff comes from building automation / controls. I like to do things in a way that helps me develop a lesson plan to teach the material to others. It is the way I think and learn, make mistakes and share with others.
With the resistor as today’s victim I am working through an old school function generator with generic BNC leads microclips attached, an oscilloscope with built in waveform generator, FFT function and nullable 500 Meg probes. Next in line is a shiny new Rohde & Schwarz HM 8118 LCR bridge with test fixture sitting here next to me.
I am also thinking about using a buffer amplifier between the DUT and the instrument to overcome the probe’s impedance. People studying noise effects use this method. What do you think?
DT
Hi DualTriode,
Actually, an impedance analyzer is the correct tool, or a network analyzer. Something like a 4195A can correct for the L,C & R of the leads. The leads must be very similar to the factory accessory in order for the analyzer to cope with the impedance variations. High frequency sweeps are done with a test fixture connected right at the terminals.
Even a spot frequency tester can null it's test leads, like a 4263A. At the highest frequency range (100 KHz on that one) the test fixture must be used right at the test terminals of the instrument.
-Chris
Hello Chris,
Thanks for the insights regarding the instruments that have the ability to null the probes. Since this thread is in the lounge I will share a little.
I teach hydronics at a trade school (mechanical engineering, pumps, boilers - heating and cooling stuff). Much of my interest in this electrical / electronic stuff comes from building automation / controls. I like to do things in a way that helps me develop a lesson plan to teach the material to others. It is the way I think and learn, make mistakes and share with others.
With the resistor as today’s victim I am working through an old school function generator with generic BNC leads microclips attached, an oscilloscope with built in waveform generator, FFT function and nullable 500 Meg probes. Next in line is a shiny new Rohde & Schwarz HM 8118 LCR bridge with test fixture sitting here next to me.
I am also thinking about using a buffer amplifier between the DUT and the instrument to overcome the probe’s impedance. People studying noise effects use this method. What do you think?
DT
Audible?
Hello All,
I have taken a closer look into the modeling of the resistor equivalent circuit. First we make the assumption that a resistor faithfully follows Ohm’s Law from DC to RF, for any voltage differential, and for any temperature. We have the suspicion that an inductor may be the passive family’s bad boy. The resistor in not the model child we thought he was.
Noise is commonly talked about other place. Resistors are not linear with changing temperature, less commonly talked about. Even less frequently talked about is resistor nonlinearity due to voltage drop across the resistor.
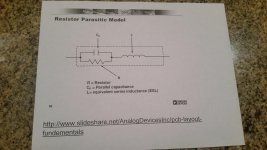
As posted here a few times, the impedance of a resistor also changes with frequency. Googling about I found the theory and several similar resistor parasitic models posted on sites including Analog Devices and Vishay. See the Analog Device contribution in the attached photo below. There is leakage capacitance parallel to the body of the resistor. There is an additional equivalent series inductance. With increasing frequency the impedance holds steady then the capacitance begins to shift the phase angle negative then the inductance begins to shift the phase angle in the positive direction. Where the capacitance dominates the impedance falls at 20db per frequency decade. Where the inductance dominates the impedance increases at 20db per frequency decade. The bigger the body, the larger the value in ohms and the longer the leads the more pronounced the parasitic effects are.
This stuff is not all just theory. With audio analyzer, frequency generator, 6 ½ digit DVM and bridge component tester (HM8118) I have tested more than a few values and types of resistors. My test results seem to match the Vishay and Analog Devices theory. This phase shift and nonlinear impedance stuff does creep into the audio frequency range, especially with the multiple resistors and leads soldered together into the Wheatstone bridge configuration for distortion testing.
Audible?
DT
Hello All,
I have taken a closer look into the modeling of the resistor equivalent circuit. First we make the assumption that a resistor faithfully follows Ohm’s Law from DC to RF, for any voltage differential, and for any temperature. We have the suspicion that an inductor may be the passive family’s bad boy. The resistor in not the model child we thought he was.
Noise is commonly talked about other place. Resistors are not linear with changing temperature, less commonly talked about. Even less frequently talked about is resistor nonlinearity due to voltage drop across the resistor.
As posted here a few times, the impedance of a resistor also changes with frequency. Googling about I found the theory and several similar resistor parasitic models posted on sites including Analog Devices and Vishay. See the Analog Device contribution in the attached photo below. There is leakage capacitance parallel to the body of the resistor. There is an additional equivalent series inductance. With increasing frequency the impedance holds steady then the capacitance begins to shift the phase angle negative then the inductance begins to shift the phase angle in the positive direction. Where the capacitance dominates the impedance falls at 20db per frequency decade. Where the inductance dominates the impedance increases at 20db per frequency decade. The bigger the body, the larger the value in ohms and the longer the leads the more pronounced the parasitic effects are.
This stuff is not all just theory. With audio analyzer, frequency generator, 6 ½ digit DVM and bridge component tester (HM8118) I have tested more than a few values and types of resistors. My test results seem to match the Vishay and Analog Devices theory. This phase shift and nonlinear impedance stuff does creep into the audio frequency range, especially with the multiple resistors and leads soldered together into the Wheatstone bridge configuration for distortion testing.
Audible?
DT
Attachments
- Status
- Not open for further replies.
- Home
- Member Areas
- The Lounge
- Resistor Sound Quality?