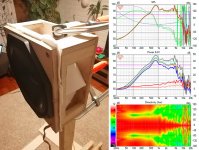
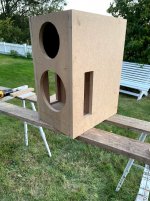
Had a hour of spare time so had enough time to slice the melamine sponges and take measurements. Didn't have time to move the port location or test the new materials that finally got here, some felt and hard acoustic board! can't wait trying them out.
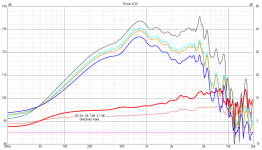
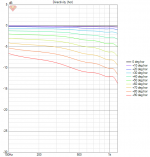
Alright, the DI didn't get any higher (above 6dB), except some at the low end of the bandwidth and a bit smoother DI overall but the smoothness can be a measurement issue (DI bump ~500Hz). The DI is rising, no flat.. I can tilt the DI like so in the emulation by the shelving filter so I think the tilt is due to the damping material, would have to slice and measure some more to see if the DI gets even flatter.
The smoother looking response on the attachments was measured with the sliced melamine sponges. The other one is the control, a box from last measurement set #277 that has melamine sponges on the ports and 1 layer of Ewona insulation on the back chamber.
The idea on the cut was to get the melamine thinner to reduce attenuation and delays as well as the surface more parallel to the driver cone and frame to get more of the sound transmitted (out the box) and less reflected due to the smaller incident angle. The slice clearly had positive effect to the response, but of course I have no way to show what actually happens there in reality 😀
What you all think about of it all, does it make sense, is it all just measurement error or what? The ports are huge on the proto, path length around the port to the front is only few centimeters and the melamine is so thin now I can almost see trough and the response is getting pretty nice. It feels weird so little anything has so much effect but all improvements have been driven by insight from the emulation and it has been working so far so it feels nice. Well, the polar map I haven't been able to replicate exactly in the emulation but all the tunings have been steps closer to the target, flat DI ~200Hz - 1200Hz. Not there yet, getting closer on the flatness, such fun 😀
Attachments are:
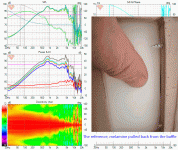
1. gif showing the difference fast
2. closer look at the control DI line (full melamine sponges)
3. DI with the sliced melamine sponges
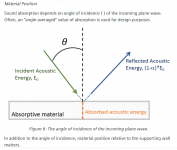
4. illustration of insident angle, taken from Siemens sound absorption article
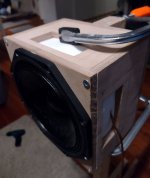
5. the DUT
6. Sliced melamine seen from the end. The narrow tip goes against baffle, flat part against sidewall and wedge towards the cone.
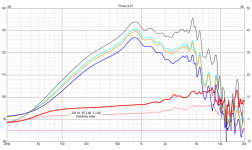
Alright, the DI didn't get any higher (above 6dB), except some at the low end of the bandwidth and a bit smoother DI overall but the smoothness can be a measurement issue (DI bump ~500Hz). The DI is rising, no flat.. I can tilt the DI like so in the emulation by the shelving filter so I think the tilt is due to the damping material, would have to slice and measure some more to see if the DI gets even flatter.
The smoother looking response on the attachments was measured with the sliced melamine sponges. The other one is the control, a box from last measurement set #277 that has melamine sponges on the ports and 1 layer of Ewona insulation on the back chamber.
The idea on the cut was to get the melamine thinner to reduce attenuation and delays as well as the surface more parallel to the driver cone and frame to get more of the sound transmitted (out the box) and less reflected due to the smaller incident angle. The slice clearly had positive effect to the response, but of course I have no way to show what actually happens there in reality 😀
What you all think about of it all, does it make sense, is it all just measurement error or what? The ports are huge on the proto, path length around the port to the front is only few centimeters and the melamine is so thin now I can almost see trough and the response is getting pretty nice. It feels weird so little anything has so much effect but all improvements have been driven by insight from the emulation and it has been working so far so it feels nice. Well, the polar map I haven't been able to replicate exactly in the emulation but all the tunings have been steps closer to the target, flat DI ~200Hz - 1200Hz. Not there yet, getting closer on the flatness, such fun 😀
Attachments are:
1. gif showing the difference fast
2. closer look at the control DI line (full melamine sponges)
3. DI with the sliced melamine sponges
4. illustration of insident angle, taken from Siemens sound absorption article
5. the DUT
6. Sliced melamine seen from the end. The narrow tip goes against baffle, flat part against sidewall and wedge towards the cone.
Attachments


Last edited:
Don, how are you planning on modeling the damping material in AKABAK? I have been tinkering with various cabinet profiles/vent alignments for the same purpose. However, I have not found a good way to emulate the damping material.
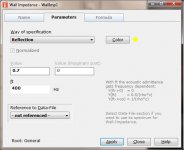
The damping or reflection specs eventually just becomes an acoustic impedance in AKABAK. If you have a measured impedance data file you get the best results. Otherwise if you are experimenting to see what might work use the built in reflection and damping (absorption) wall impedance models. I specify my models as follows only because it makes sense in my mind.
If the wall (chamber surface) is part of a volume intended to contain and attenuate reflections (via volume fill) I use the reflection model like [R,f]=[0.7,400] to approximate mild damping (absorption) using the walls. In the example, the reflections will start high at 70% (LF) and be significantly attenuation by 400Hz.
If the surface is intended to pass the wavefront (port damping) I put a "gateway"surface either in the port tube or at its boundary to the attached chamber. Then I specify a damping model [D,-f]=[1,-700] to approximate the wave front passing through the surface at LF and attenuating significantly at 700Hz. This seems counter intuitive but D=1, means Zn=Zo, which is the impedance of air so the tube acts like its open. As the impedance increases with frequency the port closes off.
It is interesting we seem to approach the DUT from opposite perspectives, you are thinking through the bass box perspective and I've been thinking it from no box perspective, a naked dipole driver as starting point. I've been using big ports and minimal stuff in my experiments to have barely enough box to get the little delay needed for the response and accepted the bass is lost like in dipole configuration as the trade-off.
I've never thought of the box and ports in this application nothing more than an acoustic low pass. A dipole as a starting point is almost there, it has max output at the back, equal that of the front but opposite phase. All one needs to do to dipole to get the other patterns have some delay to steer the null past 90 degrees and not attenuate the output off the back to preserve the cancellation.
Anyway, different perspectives are good, I'll follow what you come up with since it is all new to the discussion so far I think!🙂
🙂 good observation, that means we should meet half way with an improved solution 🙂
I'll post some observation field pics showing how the port output is interacting with the driver.
Yeah, main motivator for me to try the leaky box was to get rid of all sort of boxy effects off from the mid driver response, reflections are not good thing here I think. With bass they can be used for advantage but on the mid driver I'm not so sure if there is any benefit. Dipole would have least problems in this regard, but I've read it doesn't work well positioned near wall. Have to try some day though.
I thought acoustic filters would have same effect as electrical, phase and frequency response are the same thing in different domain, but I'm not confident talking about phase and group delay and what not in this context. I have to admin I never had the a-ha moment with group delay 😀 All I know the experiments have been working pretty nice so far with very rudimentary reasoning so I'm still avoiding studying the group delay until I have to, some day 🙂
It looks like your experiment is working with about 6dB improvement. I've read 5 reviews and some measurements of the DD-C8 and they claim about 10dB. Once I get a model I'm happy with, I might build a box to measure it to see how close the sim was. I have some 8" SilverFlutes lying around that should work.
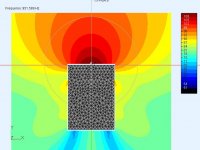
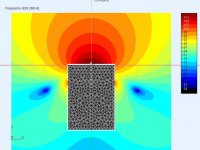
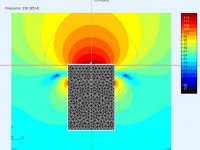
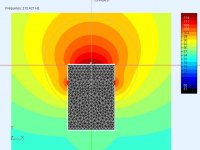
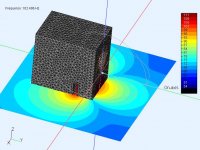
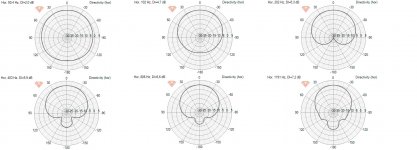
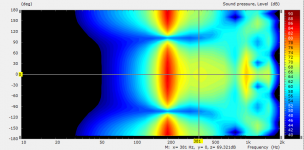
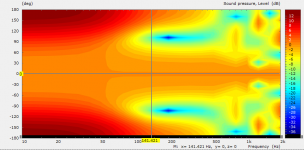
A few graphs so far. Interesting plots showing SPL around the box and interaction between the ports and driver.
.
.
Attachments
-
 DirPlot@951Hz.jpg53.4 KB · Views: 176
 -
 ObsFieldXY@951Hz.jpg45.1 KB · Views: 171
 -
 DirPlot@600Hz.jpg53.2 KB · Views: 163
 -
 ObsFieldXY@609Hz.jpg46.1 KB · Views: 151
 -
 DirPlot@340Hz.jpg53.7 KB · Views: 163
 -
 ObsFieldXY@336Hz.jpg44.3 KB · Views: 145
 -
 DirPlot@215Hz.jpg54.4 KB · Views: 160
 -
 ObsFieldXY@215Hz.jpg43.8 KB · Views: 150
 -
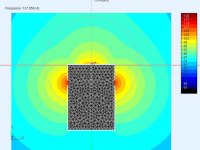 ObsFieldXY@137Hz.jpg43.9 KB · Views: 163
 -
 ObsFieldXY@102Hz.jpg62.3 KB · Views: 195
Amazing these modern simulations!
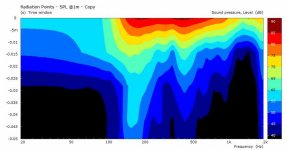
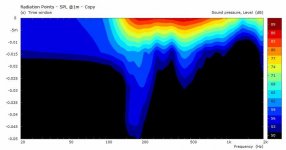
Is it possible in AKABAK to show a dispersion spectrogram 20-20 000Hz? I know there are "always" some specific problematic frequencies anyway where directivity is lost or exaggerated.
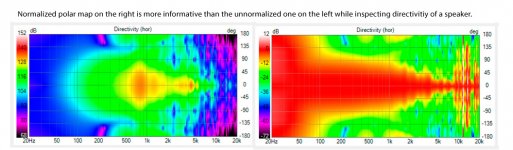
tmuikku, looks like you are showing normalized directivity spectrograms from Vituixcad2. This is OK in this project, but the screenshots don't tell they are normalized... Someone might get confused!
Is it possible in AKABAK to show a dispersion spectrogram 20-20 000Hz? I know there are "always" some specific problematic frequencies anyway where directivity is lost or exaggerated.
tmuikku, looks like you are showing normalized directivity spectrograms from Vituixcad2. This is OK in this project, but the screenshots don't tell they are normalized... Someone might get confused!
The closest thing I see is a 2D decay spectrogram in VACS. However this is a first time I tried it. Anything more (CSD waterfall) may require REW or Octave.
.
.
Attachments
Last edited:
🙂 good observation, that means we should meet half way with an improved solution 🙂
I'll post some observation field pics showing how the port output is interacting with the driver.
It looks like your experiment is working with about 6dB improvement. I've read 5 reviews and some measurements of the DD-C8 and they claim about 10dB. Once I get a model I'm happy with, I might build a box to measure it to see how close the sim was. I have some 8" SilverFlutes lying around that should work.
Yes! Although it would be much more exciting if multiple tunable solutions are found!🙂
I'm not sure which improvement you write specifically so I'll post few more graphs since at least few people are interested.
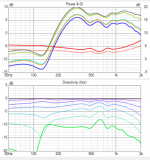
Juhazi, thanks you for pointing that out. I've mentioned the normalization on multiple occasions but don't always remember to make it clear with every post. Since we are tuning the polar response it makes sense to normalize.tmuikku, looks like you are showing normalized directivity spectrograms from Vituixcad2. This is OK in this project, but the screenshots don't tell they are normalized... Someone might get confused!
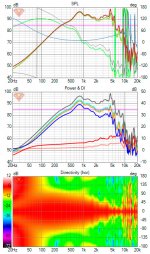
First attachment illustrates the difference between normalization and without. Much easier to see the polar response with normalization. When the DI is smooth EQ can flatten the other graphs no problem. Normalization shows what the response was if on-axis (normalization axis) was EQ:d flat, any acoustic issues of the system would show here as ridges and valleys. I haven't been paying attention to the other graphs than the normalized polar map and the DI curve for this very reason. Get DI flat / smooth and you've got a very fine loudspeaker, no acoustic issues. I've kept posting the listening window SPL and other graphs to see if the measurements match between each other where there is sufficient resolution above 1kHz. It would reveal issues in the measurement rig I think.
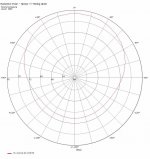
Alright few more images exported from VituixCAD attached. This is same data as I posted yesterday, the sliced melamine sponge prototype, just in different representations and beautified like it often is for the public. I've limited the charts to 100-1200Hz bandwidth and to 90 degree angle, normalized to on-axis. You've seen the rest on the previous posts 🙂
The attachments show the pattern as a line chart and a polar chart as well as a surface chart with old project as comparison. I wish VituixCAD could export GIF animation of the polar chart over bandwidth, that would be nice.
I'm really happy with the listening window response here, void of any reflections and resonances and diffraction that I've always had before and without any bracing or roundovers or slants. Very easy and cheap woodwork. The last image contains comparison of wide baffle closed box proto with very complicated box inside, nasty build, nasty response. I value this smooth listening window response more important personal audio project victory than the polar pattern, which is a nice added bonus. Trade off for all this is mainly losing the bass but bass is fixed by adding 15" woofers to taste.
Anyway, it looks like 90 deg off-axis line crosses -10dB around 400Hz, not too bad 🙂 Mind you, the measurement resolution affects the smoothness quite a lot especially on the lower end of the bandwidth, but still. All measurements I have posted are one side measured in 15 deg steps, 4ms window in a living room situation.
Attachments

Last edited:
If the wall (chamber surface) is part of a volume intended to contain and attenuate reflections (via volume fill) I use the reflection model like [R,f]=[0.7,400] to approximate mild damping (absorption) using the walls. In the example, the reflections will start high at 70% (LF) and be significantly attenuation by 400Hz.
If the surface is intended to pass the wavefront (port damping) I put a "gateway"surface either in the port tube or at its boundary to the attached chamber. Then I specify a damping model [D,-f]=[1,-700] to approximate the wave front passing through the surface at LF and attenuating significantly at 700Hz. This seems counter intuitive but D=1, means Zn=Zo, which is the impedance of air so the tube acts like its open. As the impedance increases with frequency the port closes off.
Interesting, so by volume fill I assume you mean simulating literally filling the speaker chamber with absorption material? Never would have thought of that. I tried the LEM approach by filtering the back-wave but it always gave funky results that I wasn't sure I could trust.
As for the port style, Are you making full 3D geometry block for the damping material, or is it just a 3D plane at the port location? If just a plane, I assume the 3D surface normals face inward toward the speaker cone?
Also, for both cases, where exactly in the software you defining the model?
Much easier to see the polar response with normalization
Agree it is much easier to reason about the directivity with the graphs normalized. Can worry about pesky things like resonances later 😀
Attachments
Last edited:
^^
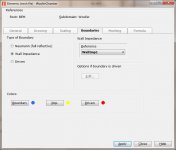
AKABAK is BEM (not FEM) so we mimic the effect of filling the entire volume by applying a wall impedance to all the boundary walls. Nothing wrong with using LEM for a sealed chamber as long as the chamber is not too irregular shaped or interacting with other components.
Depends what you are modelling. If its a smaller block of damping placed in the middle of a larger chamber then you will have to create the block and apply damping to it's walls. Normals pointing outward.
In the General tab add a wall impedance object (pic#1). In the BEM tab apply that wall impedance object to the BEM object (pic#2). Impedance will be applied to all surfaces in that BEM object.
"Interesting, so by volume fill I assume you mean simulating literally filling the speaker chamber with absorption material? Never would have thought of that. I tried the LEM approach by filtering the back-wave but it always gave funky results that I wasn't sure I could trust."
AKABAK is BEM (not FEM) so we mimic the effect of filling the entire volume by applying a wall impedance to all the boundary walls. Nothing wrong with using LEM for a sealed chamber as long as the chamber is not too irregular shaped or interacting with other components.
As for the port style, Are you making full 3D geometry block for the damping material, or is it just a 3D plane at the port location? If just a plane, I assume the 3D surface normals face inward toward the speaker cone?
Depends what you are modelling. If its a smaller block of damping placed in the middle of a larger chamber then you will have to create the block and apply damping to it's walls. Normals pointing outward.
Also, for both cases, where exactly in the software you defining the model?
In the General tab add a wall impedance object (pic#1). In the BEM tab apply that wall impedance object to the BEM object (pic#2). Impedance will be applied to all surfaces in that BEM object.
Attachments
Last edited:
Yes! Although it would be much more exciting if multiple tunable solutions are found!🙂
I'm not sure which improvement you write specifically so I'll post few more graphs since at least few people are interested.
Improvements like improving the DI by shaping the ports, location and output. Ideally the port output would be advanced w.r.t the driver but that's not really possible in a passive system.
I'm really happy with the listening window response here, void of any reflections and resonances and diffraction that I've always had before and without any bracing or roundovers or slants. Very easy and cheap woodwork. The last image contains comparison of wide baffle closed box proto with very complicated box inside, nasty build, nasty response. I value this smooth listening window response more important personal audio project victory than the polar pattern, which is a nice added bonus. Trade off for all this is mainly losing the bass but bass is fixed by adding 15" woofers to taste.
Anyway, it looks like 90 deg off-axis line crosses -10dB around 400Hz, not too bad 🙂 Mind you, the measurement resolution affects the smoothness quite a lot especially on the lower end of the bandwidth, but still. All measurements I have posted are one side measured in 15 deg steps, 4ms window in a living room situation.
That's good to know, you experienced a audible and measured difference using the prototype.
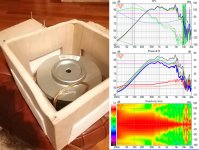
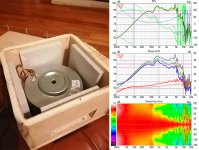
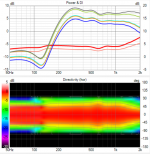
Felt
Here are measurements with felt. This particular felt is made out of plastic if I understood correctly, recycled bottles or something. Few millimeters thick, maybe 3mm.
Tried it on the big enclosure as well as on the small one. It looks like the felt adds the resistance or something on the big box, the acoustic low pass seems to be too low. On the small box, the acoustic low pass seems to be too high. But, the felt seems to have the right kind absorption coefficients since the DI is flat! It looks like the absorption "shape" is right but something else is now not right and I suspect the acoustic low pass needs to be adjusted. I'll experiment further, maybe tomorrow.
There is some kink on the DI around 500-1000Hz, not sure what caused it, have to see if it happens next time and try to address it somehow. These materials tested are very hard, they don't compress much at all in comparison to the Ewona and Melamine sponge tested earlier.
Attachments are
1. control from previous set, the sliced melamine on the ports, one layer Ewona backfill.
2. felt on the ports outside of the enclosure, one layer Ewona backfill. Felt inside the enclosure is bit different, same with felt on both in and out, but the trend looks the same.
3. small box, felt and backpanel. Without backpanel was even more dipole, with back panel this. Next time block top and bottom to get the acoustic low pass bit lower.
4. Also tried Echo Jazz Echoboard, but that seems to give too high attenuation. Gonna experiment with this as well, make it attenuate less somehow.
Polar maps are normalized and the same measurement setting as before. Trying to keep the setup constant and always include a control measurement to compare against. The control box didn't measure exactly like few days ago but it clearly has same characteristics, see post #321.
Attachments
Last edited:
tmuikku, the "plastic felt", would that be used for making clothes stiffer? It is sometimes called interfacing.
Amazing work you guys are doing 
In Vituix cad the drivers seem to be defined as point sources, which is to a large extend an ok approximation.
Maybe this could even be used to simulate many separate smaller holes in like a perforated plate. I know D&D have achieved super results with a slot like hole. But was thinking if you could get the dipole to work smoother over a wider freq range by extending the holes further back.
I would guess this is what is done with the Amphion Krypton.
Just a thought.
Attachments
Edit ... see Vituix cad does not just use point sources ... by bad ... anyways still same thoughts
Hi all,
drewmc, the felt should be this: https://www.akustiikkapalvelut.fi/tiedostot/Huopa-PET.pdf
Unfortunately I haven't found other info on it.
paalj, thanks for the link! On a quick check it seems to talk about box compliance and resistance forming a time delay. Finally something that relates resistance to all this! Need to look further into it. I think box compliance is what DonVK is playing with as well.
Baldin, there might be a way but it would be emulation like any simpler model where the operator is in charge of tuning the parameters to approximate real world object. Maybe the BEM analysis would help better. It looks like there are many ways to achieve some kind of cardioidish response so Amphion might have chosen that pattern for aesthetic reasons as well.
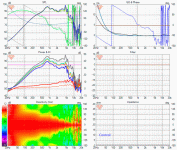
Anyway, tried few experiments on the weekend but not the ones planned. My graphs have turned into stair steps and I don't know why 😀 Maybe something wrong with the measurement setup or maybe VituixCAD update changed how the data is interpolated or something, didn't check the change log yet.
Noticed my jig was getting loose, tightened it up and ~1"/3cm change in the measurement rotation axis. Pretty dramatic droop on the jig didn't change the shape of the graphs at all although DI got bit lower with the more accurate, tightened up jig. Anyway, shows that stairsteps happen anyway, everything is setup the same like last two measurement sets posted earlier.
Depressed on the issue I started to fiddle with the melamine. Pulling the wedged melamines off from the baffle so much so they almost leave a gap on the port. This seemed to widen the pattern control bandwidth below 100Hz. Might be measurement anomaly. Anyway, thought to make another experiment with adjusted damping material with added slices of Ewona in the box corners where there was no melamine (which is was against baffle, like earlier, the control). This seemed to change some reflections inside the box. See the dance between 300-500Hz. notice how the power / Di graph straightens up there.
So, if any embarks such project just take your time to tuning the box 😀 Luckily, this kind of experiments with a prototype box are practically free other than tons of time and coffee, endless variations 😀 I'm not sure any of these scenarios differ much in sound. They would get pretty much the same treatment in the system crossover for example.
Attachments,
1. GIF measurement jig loose / tightened.
2. GIF control box with and without Ewona strip on inside corners.
3. illustrating the pulled back melamine, the melamine is pulled back from the baffle (right of the picture) to almost leave a gap to see the back of the cone.
drewmc, the felt should be this: https://www.akustiikkapalvelut.fi/tiedostot/Huopa-PET.pdf
Unfortunately I haven't found other info on it.
paalj, thanks for the link! On a quick check it seems to talk about box compliance and resistance forming a time delay. Finally something that relates resistance to all this! Need to look further into it. I think box compliance is what DonVK is playing with as well.
Baldin, there might be a way but it would be emulation like any simpler model where the operator is in charge of tuning the parameters to approximate real world object. Maybe the BEM analysis would help better. It looks like there are many ways to achieve some kind of cardioidish response so Amphion might have chosen that pattern for aesthetic reasons as well.
Anyway, tried few experiments on the weekend but not the ones planned. My graphs have turned into stair steps and I don't know why 😀 Maybe something wrong with the measurement setup or maybe VituixCAD update changed how the data is interpolated or something, didn't check the change log yet.
Noticed my jig was getting loose, tightened it up and ~1"/3cm change in the measurement rotation axis. Pretty dramatic droop on the jig didn't change the shape of the graphs at all although DI got bit lower with the more accurate, tightened up jig. Anyway, shows that stairsteps happen anyway, everything is setup the same like last two measurement sets posted earlier.
Depressed on the issue I started to fiddle with the melamine. Pulling the wedged melamines off from the baffle so much so they almost leave a gap on the port. This seemed to widen the pattern control bandwidth below 100Hz. Might be measurement anomaly. Anyway, thought to make another experiment with adjusted damping material with added slices of Ewona in the box corners where there was no melamine (which is was against baffle, like earlier, the control). This seemed to change some reflections inside the box. See the dance between 300-500Hz. notice how the power / Di graph straightens up there.
So, if any embarks such project just take your time to tuning the box 😀 Luckily, this kind of experiments with a prototype box are practically free other than tons of time and coffee, endless variations 😀 I'm not sure any of these scenarios differ much in sound. They would get pretty much the same treatment in the system crossover for example.
Attachments,
1. GIF measurement jig loose / tightened.
2. GIF control box with and without Ewona strip on inside corners.
3. illustrating the pulled back melamine, the melamine is pulled back from the baffle (right of the picture) to almost leave a gap to see the back of the cone.
Attachments

Last edited:
I grinded down the baffle a bit and rounded some edges. I also moved the MIC up between tweeter and MF. DI seems to be within 4-5 in the actual range. The tweeter has a DI of about 5 @ 1,3k so it might fit the DI of the MF. We will see if it is possible to make an "invisible" XO. I will try linear FIR filters in "Acourate" first.
Attachments
Last post today. I made a linear phase FIR LR4@ 100 and 1,25kHz and linearized the drivers. The power response seems to survive through the XO at 1,25k. The Monacor WG 300 seems not to fit very good. Any proposals for a WG/tweeter that might be a better fit?
Attachments

- Home
- Loudspeakers
- Multi-Way
- Resistive port cardioid active speaker insipired by D&D 8C