A basic question if I build an amplifier from bottom up and for example the tube datasheet states K88 Zout (@ 500V) 4.8K and 4.5K (@375V) so is it as simple to match that ?
For the above example if I would have 375 V B+ I would take a OPT with primary impedance around 4.5K ? like 4.3K / 4/8/16 Ohm secondary) assuming the primary current and wattage is ok.
So is it as simple as to match the tube datasheet Zout for a given B+ with primary impedance of the OPT ?
Thx !
For the above example if I would have 375 V B+ I would take a OPT with primary impedance around 4.5K ? like 4.3K / 4/8/16 Ohm secondary) assuming the primary current and wattage is ok.
So is it as simple as to match the tube datasheet Zout for a given B+ with primary impedance of the OPT ?
Thx !
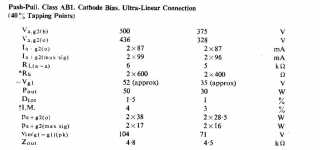
I think you are looking at the data for ultra-linear push-pull operation of the KT88 so I asume you want to build that. You should not look at "Zout" but at "RL(a-a)", which stands for the primary impedance seen from anode to anode.
Thx Robert ! , so in this case I just take the (for example) 375 Volt , RL(a-a) 5K , so a 5K primary impedance of the OPT would be to aim at ?
Actually just noticed the datasheet lists the example data for Va.g2(b) and not Va ?
Is that the voltage between anode and g2 (screen) so with a 40% UL tap winding the datasheet example means 40% of B+ / Va ?
Actually just noticed the datasheet lists the example data for Va.g2(b) and not Va ?
Is that the voltage between anode and g2 (screen) so with a 40% UL tap winding the datasheet example means 40% of B+ / Va ?
Attachments
Last edited:
"Va,g2(b)" is the voltage at the centretap of the OPT. "Va,g2(0)" is the voltage at the anode with no input (music) signal. The difference between these two values is caused by the (assumed) dc-resistance of the primary of the OPT between the centretap and one of the connections for an anode.
Ofcourse the value of Va,g2(0) depends on the actual OPT you are going tu use (the dc-resistances can vary). Don't pay too much attention to this. If the OPT is good enough, than the dc-resistance will not be too high.
If they wanted to be very precise in the datahseet, than they should have given a seperate voltage for the g2 tap. That voltage would be slightly higher than Va,g2(0), but slightly lower than Va,g2(b).
So look at the value for Va,g2(0) as being a practical indication.
Thx Robert, this is really helpful, and if they wanted to be precise should there then not be a graph / curve detailing the RL(a-a) value for a given Va,g2(b) ? , so for a different Va,g2(b) I just lineair make a best "calculated" guess ?
Although I understand the transformer primary impedance will vary with the speaker impedance at a certain frequency so it is always very dynamic.
The best way would be to use the last set of curves for 40% ul in the datasheet (page 8 of the datasheet I'm looking at) but to do this for push-pull operation requires quite some insight and labour. I never did that myself; I just followed one of the proposed settings for ul (40%) pp operation in the datasheets.
Edit: I must say that the differences between Va,g2(b) = 500 V (and 375 V) and Va,g2(0) = 436 V (and 328 V) are pretty high (see page 3). With the 500 V it would mean that the dc-resistance of half the winding of the primary is some 735 Ohm. So maybe I'm mistaking over the true meaning of Va,g2(b). But I would not know what it could mean otherwise.
Edit: I must say that the differences between Va,g2(b) = 500 V (and 375 V) and Va,g2(0) = 436 V (and 328 V) are pretty high (see page 3). With the 500 V it would mean that the dc-resistance of half the winding of the primary is some 735 Ohm. So maybe I'm mistaking over the true meaning of Va,g2(b). But I would not know what it could mean otherwise.
Last edited:
If you're starting from scratch at 375V, you should draw the load lines on the ultra-linear curves to determine a transformer impedance that will work for what you're doing.
If that is more than you want to deal with, it's far easier to just stay in class A with triode strapped valves.
If that is more than you want to deal with, it's far easier to just stay in class A with triode strapped valves.
The load line in the real world became an ellipse.
The calculation of the working point and the related impedance of trafo is done considering a resistive load, for semplicity.
In my opinion I prefer to fix the point for a load of 5 ohm for p-p (as Manley said)
In this way I am quite sure tha also when the Zload goes down I will have a reasonable good transfer of energy to the speaker.
In practical with test lab in this situation I will get lower rms power but better dynamic.
It is possible to see the results with a test that in Audioreview magazine in Italy we call "Limited load charatheristic" where with a particular program wrote for AP1 we can see the curve of the power delivered to different load swithched by a sequence of relais driven by program, from 16 ohm to 2 ohms in different steps
Walter
Walter
waltube,
Thanks for all of that.
And thanks for bringing us back 'around' to the ellipse (pun intended, but it also is the not so simple truth).
When I first get a different speaker (new or used), one of the first measurements I make is the DCR at the input terminals.
It tells me something about the woofer and its low pass choke, and that the minimum impedance will be at least that low, usually at far below woofer resonance, and usually at high bass to mid frequency.
Last edited:
Thx, I do want to put the effort in so will read/ learn how to draw a load line for OPT determination.
If a tube datasheet states for example 3 K Load resistance rla-a. For a push-pull configuration I assume each part of the primary winding need to be 3K? so the OPT should be a 6K one total primary ? Seems logical, just would like your confirmation.
to 6A3summer
It is a semplification to understand the issues on real world.
In attach a diagram (from Audioreview site) of the modulus of impedance ( and phase) of a loudspeaker.
In the region where the energy of the sound is important there is a peak where in a little range of frequencies the impedance is changing rapidly.
We start at 10 ohm at 20 Hz, goes at 50 ohm around 55 Hz then fall at less of 10 ohms at 200 Hz.
For the high frequency it tends to increase continously until 20 kHz ( and this a benefit, then I will show why).
If I have a trafo with 20:1 ratio you can understand what will happen to the load line.
In addition you can see at resonance frequency that the fase change immediately ( this means ellipse) from +40° to -40° in the range of 30-80 Hz.
Another consideration.
We can image that at T= 0 there is a signal at 40 Hz and after microsecond ( it is only an example) another signal at 60 Hz, the Z will increas from around 22 ohm to around 48 ohm, more than double. But also phase will change.
Then another signal from 60 Hz to 100 Hz, the Z drop from 48 ohm to 10 ohm
Lot of problems!
Another consideration, it is mainly a question for you:
One loudspeaker, p.e. a woofer, how can reproduce in the same time two different frequencies ( we consider it as a musical signal)?
I will be back 🙂
Walter
Attachments

P.s.
I forgot to add this diagram.
It is a frequency response of a trafo without iron.
Interesting?
We can assume that the iron plays a great rule until, I say, 500 Hz (-1 dB)
But in this range lot of things happen that are heavely respect high frequencies ( under a certin point of view).
Walter
I forgot to add this diagram.
It is a frequency response of a trafo without iron.
Interesting?
We can assume that the iron plays a great rule until, I say, 500 Hz (-1 dB)
But in this range lot of things happen that are heavely respect high frequencies ( under a certin point of view).
Walter
Attachments

Raa is anode to anode, hence across the whole primary.
😱 Now I feel incredibly stupid, it actually says anode to anode ... was thrown off that although it is a datasheet of a (single) tube they do already incorporate design type and use case values.
- Home
- Amplifiers
- Tubes / Valves
- Question, Relation between tube Zout and OPT primary impedance