Quick question about speaker workshop for someone who's used it longer than I have (2 days).
When I model a crossover and open "crossover.chart" it's only showing the response of the crossover without drivers, right?
I just want to make sure I'm doing the right thing when I open the properties for crossover.chart and add the driver responses to it manually (then it flattens out) or if I'm doing something wrong.
Thanks in advance!
SW has some glitches, but works ok.
I would create a couple of drivers with flat f/r and a flat imp, and then use these to do some xovers, to get used to this part of sw.
I would create a couple of drivers with flat f/r and a flat imp, and then use these to do some xovers, to get used to this part of sw.
Hi DrDyna, I'm actually not sure which part of speaker-workshop you are using. I've never seen a .chart with crossovers (maybe you've stumbled across something I haven't!
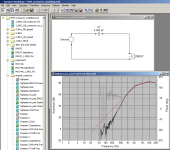
See the image below. It shows the tweeter network, and the calculated response. if you right click on the network and click calculate response then it should give you the actual response curve that you can expect (with a few caveats) You need to have measurements of the actual drivers raw response and impedance for this to work. either measured in SW or in something else and imported. The images chart also has the crossover goal dataset added to it.
Can you describe how you are getting to crossover.chart (I assume you named your network crossover
Tony.
Attachments
Hi DrDyna, I'm actually not sure which part of speaker-workshop you are using. I've never seen a .chart with crossovers (maybe you've stumbled across something I haven't!
See the image below. It shows the tweeter network, and the calculated response. if you right click on the network and click calculate response then it should give you the actual response curve that you can expect (with a few caveats) You need to have measurements of the actual drivers raw response and impedance for this to work. either measured in SW or in something else and imported. The images chart also has the crossover goal dataset added to it.
Can you describe how you are getting to crossover.chart (I assume you named your network crossover
Tony.
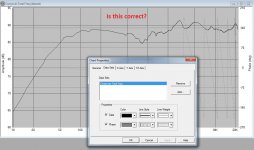
Yeah, what's happening is when I create a crossover and then generate the response, the chart I get is different. When I look at the properties of the chart where you can change the color of the lines and stuff, the only thing listed is the crossover. If I "add" the drivers to the response (the woofer and the tweeter) then it flattens out and I can see the slopes of the drivers, if I color all the lines differently.
Is the response the same, but I'm just changing the scaling somehow?
Edit: I've been tracing SPL and Impedance with SPLTrace.
Edit2: Now that I'm staring at it, I guess it's because the amplitude range goes up with the drivers in it, I hadn't noticed that before. Damnit!
Attachments
Last edited:
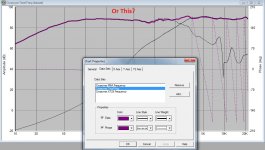
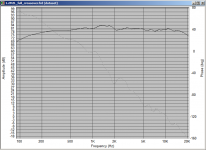
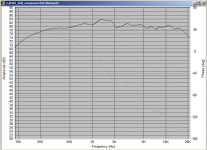
yes that will do it! 🙂 I try to use a 70 db range I've been doing 20 to 90 db, but sometimes with the crossover if you want to see the full slope you need more. a 35db range like what you have in the first pic makes the response look rather ragged, what you should do with that tight a range is change your y axis tick to 1db (or perhaps even 0.5db) to put things into perspective. if you put your centre point around 88db you are probably around +-3db with respect to 88db.
attached are two versions of an spl measurement I did. both are identical except for the y axis scale as per your two above. It's always important to look at the range when checking measurements, some manufaturers curves have very big ranges which makes the FR look much smoother 😉
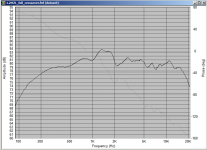
edit: I've attached a third, which is using a 70db range this is what I generally use, I think it is a good middle ground, doesn't look too horrid but gives reasonable resolution
Tony.
attached are two versions of an spl measurement I did. both are identical except for the y axis scale as per your two above. It's always important to look at the range when checking measurements, some manufaturers curves have very big ranges which makes the FR look much smoother 😉
edit: I've attached a third, which is using a 70db range this is what I generally use, I think it is a good middle ground, doesn't look too horrid but gives reasonable resolution
Tony.
Attachments
Last edited:
- Status
- Not open for further replies.