Hi
I'm at the stage where I have my two speakers built. They are 3-way with two woofers for 4 drivers altogether (perhaps regretting that bit but I'm all in now).
I've been doing some measurements and trying to design a crossover. I have roughly the response I want, I've got impedance in check (I think) but I can't make head nor tail of what i should be looking for in the phase department.
Here's what I have, can someone tell me what's wrong or right about the phase graph?


The phase at your 400 Hz crossover looks good. It appears you have a 4th order crossover network, so you should be aiming for phase alignment between the drivers. The woofer and mid phase follow each other (close enough) from 200 - 1000 Hz. They look to be only 20 to 30 degrees apart... it is hard to tell from your graphic.
Your 4.5 kHz crossover has more phase difference. It looks like about 90 degree difference between the mid and tweeter. This is a large enough phase difference to be concerned about.
Did you make measurements yourself, or is the simulation based on published information?
Very nice construction by the way...
Thank you 🙂
These measurements are from either tracing SPL charts or Dayton's supplied files so I'll be measuring each driver in it's actual location before buying any components!
So...
Are all three vertical lines supposed to be on top of each other? Or is the Red and Green at the lower crossover area supposed to be on top of each other and the green and blue lines supposed to be on top of each other at the upper crossover area?
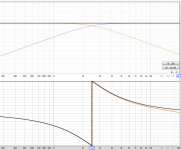
look closely at the GD&phase curve. At 450 hz, the woofer phase is about -150 degrees, and the mid curve is about -180 degrees, which is a difference of 30 degrees.
When I look at 4.5kHz, it is hard to see exactly what happens right at 4.5k because the curves are passing from -180 to 180... At 3k the difference between the mid curve and the tweeter curve is about 40 degrees... by 5k it has grown to a difference of 90 degrees.
When looking at these curves, it is not the actual value that matters, it is the difference in phase value for two different drivers that matters.
Yes, what happens away from the region of the cross is much less interesting.at the upper crossover area?
Are all three vertical lines supposed to be on top of each other? Or is the Red and Green at the lower crossover area supposed to be on top of each other and the green and blue lines supposed to be on top of each other at the upper crossover area?
The red and green should align at their crossover point and the green and blue should align at the upper crossover point.
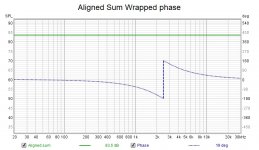
Here is an example of a synthetic LR4 crossover at 2500Hz
You can see that the phase traces overlay each other almost exactly and there is just a little bit of phase error towards high frequency that is tricky to get rid of completely.
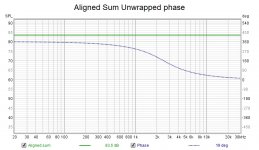
When the phase is wrapped the sum looks like this
When the phase is unwrapped you can see what is happening. The phase gets more as the frequency goes down ending up at 360 degrees due to the 4th order crossover.
Attachments
That is a really good explanation, Fluid. It leads me to a thought: perhaps there is a better way for our crossover simulation software to plot this information.
Imagine a plot option where the user can select two drivers in the simulation, and the software will plot the delta phase between the two drivers. The ideal case would be delta = 0 over a broad range above and below the crossover frequency.
I think this could be an interesting option to add to XSim or VituixCad.
.... sorry for the tangent...
The red and green should align at their crossover point and the green and blue should align at the upper crossover point.
Here is an example of a synthetic LR4 crossover at 2500Hz
You can see that the phase traces overlay each other almost exactly and there is just a little bit of phase error towards high frequency that is tricky to get rid of completely.
When the phase is wrapped the sum looks like this
When the phase is unwrapped you can see what is happening. The phase gets more as the frequency goes down ending up at 360 degrees due to the 4th order crossover.
Thank you that is very helpful.
More work required then because brining the phase in line as you explain above causes a peak at the crossover point, which does make sense.
That is a really good explanation, Fluid. It leads me to a thought: perhaps there is a better way for our crossover simulation software to plot this information.
Imagine a plot option where the user can select two drivers in the simulation, and the software will plot the delta phase between the two drivers. The ideal case would be delta = 0 over a broad range above and below the crossover frequency.
I think this could be an interesting option to add to XSim or VituixCad.
.... sorry for the tangent...
Surely the same could be said for the crossover design? Select your drivers and let it work out how to get to your target curve!
I did see a YouTube video of someone using some software which did "try a load of values" to get the flattest curve.
Hi All
Phase is hard work.
So I have a flat response, impedance where I want it and now I have the drivers in phase at their crossover points. To get the woofers in phase causes a dip at 275-325 Hz hence the bypass which subsequently causes a weird phase thing which I don't understand but it's in a frequency range long cut off by the low pass filter.
Thoughts or comment welcome!
It looks really good... keeping in mind that these are OEM response plots.
When you measure your actual responses in your box, things will change a little, but at least you can be confident that a good crossover design should be achievable.
When you measure your actual responses in your box, things will change a little, but at least you can be confident that a good crossover design should be achievable.
Whether intentionally or not you've created an elliptic low pass on the woofer by using a notch. The phase matches well right at the crossover but doesn't track as well away from it due to the slopes of LP and HP being different. This is often the trade off needed in a passive crossover to time align the drivers through filter delay.
Did you use the Vituix diffraction tool to generate off axis responses on the traced data?
Moving to taking measurements would make sense now as they will not be the same as the factory data so more time spent on this simulation won't be that useful.
Did you use the Vituix diffraction tool to generate off axis responses on the traced data?
Moving to taking measurements would make sense now as they will not be the same as the factory data so more time spent on this simulation won't be that useful.
Thanks, it is time to take proper measurements now, as you say, I wanted to make sure I could make these work.
Re tha woofer phase, below the crossover point is ok isn’t it? Above gets cut off so quickly I hope it doesn’t matter.
Re tha woofer phase, below the crossover point is ok isn’t it? Above gets cut off so quickly I hope it doesn’t matter.
Can I make tent from a quilt to take measurements in rather than humping a speaker down the garden? They must weight 60kg at least!
- Home
- Loudspeakers
- Multi-Way
- Please help me with Phase