I am looking for a program which enables me to overlay phase plots of loudspeakers. Does anyone knows a software that offers such a feature?
holm impulse?
Where did you see that option for, I just skimmed through the manual and it does not state the option of overlaying phase response curves.
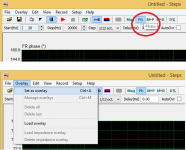
I use ARTA. How do you create Phase Overlays in Steps?
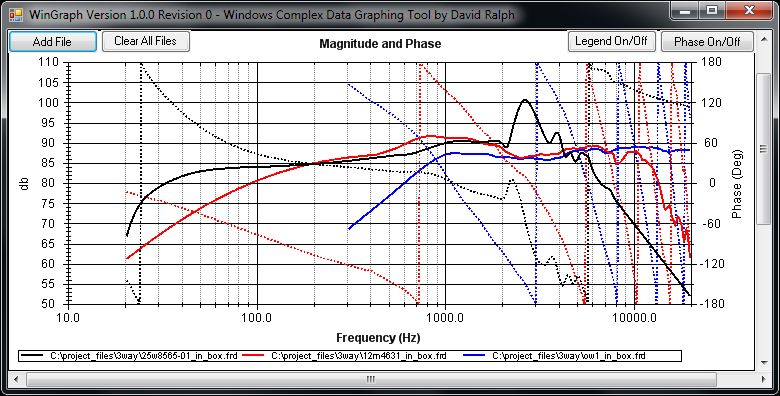
I've got a graphing program that is stand-alone that doesn't limit how many files you can import to overlay, but at the moment only the phase curves can be turned on/off in the display. The magnitude curves always display. If what you want is to import a complex data curve and turn the magnitude off, but leave the phase displayed, I can add an option to do that.I am looking for a program which enables me to overlay phase plots of loudspeakers. Does anyone knows a software that offers such a feature?
The link in my signature will take you to my page with the download. I called it WinGraph.
dlr
I've got a graphing program that is stand-alone that doesn't limit how many files you can import to overlay, but at the moment only the phase curves can be turned on/off in the display. The magnitude curves always display. If what you want is to import a complex data curve and turn the magnitude off, but leave the phase displayed, I can add an option to do that.
The link in my signature will take you to my page with the download. I called it WinGraph.
dlr
What I am looking for is phase plots in which I can overlay various speakers when measuring the magnitude. It would follow the same principal as adding as many overlays as you like in ARTA Steps on one screen however, using phase plots instead.
Will your program be capable of performing such a task?
The program is just a simple complex data plotting tool. I made it a free-standing program rather than build it into WinPCD. You import (typically) frd or zma (complex data) files with magnitude and phase. The extension doesn't matter. It will display all of them. Currently you can turn off the phase curve display or legend, that's it. There's no limit on how many curves you can import, but of course there's a realistic limit of usefulness. The files need simply be three columns that are either comma or white space delimited (space or tab). It can't handle data with a comma for the decimal, however. I've never used ARTA, so I don't know how it works.
Dave
Dave
I downloaded your program on my Windows 10 computer as I do not use Windows 7 or Windows 8. I will port over some ARTA files and see if your program can read ARTA extensions.
Cheers!
Cheers!
I use ARTA. How do you create Phase Overlays in Steps?
Attachments
- Status
- Not open for further replies.
- Home
- Design & Build
- Software Tools
- Phase Overlay Software