Greetings guys.
I've been struggling for a while trying to figure out the discrepancy between what PSpice is plotting for an over all impedance plot (green trace) vs. the simple summation of the two individual (parallel RL) impedances (fuchsia trace) in a simulation where I have exported the results into Excel and plotted it there.
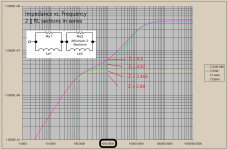
In reference to the attached impedance plot of two parallel RL sections in series (Re1 || Le1 + Re2 || Le2), I have labeled the Z's at 1000Hz for each trace. Fuchsia is simply the summation of the two separate Z's of each section (yellow stage 1, blue stage 2) while the green trace is the target trace that PSpice generates. PSpice also generated the 2 individual traces, yellow and blue.
At 1000Hz, the data is:
Z Lower (yellow) = 3.468
Z Upper (blue) = 2.8395
Z SUM (yellow + blue) = 6.3
Z SUM SIM = 4.83
Notes:
1) "Z SUM SIM" was generated by using a 1VAC input & with an "AC Sweep & Noise", and simply inverting the over all current being monitored between the source and first stage (1/i(in)). Result at 1kHz = 4.83
2) The two separate RL stage Z plots were generated by probing the differential voltage across each stage and dividing by the over all i(in).
3) "Z SUM" is simply (Z Lower) + (Z Upper). Result at 1kHz = 6.3
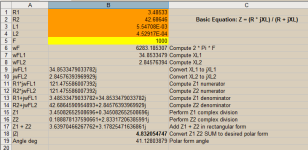
4) Using this equation in Excel: Z = R1R2/(R1 + R2 + j2piF*(L1R2 + L2R1 + L1L2))/(R1 + R2 + j2piF*(L1 + L2)), I get an over all Z result of 5.92 @ 49 degrees for both stages.
5) Using this equation in Excel for one stage: Z = R*XL / SQRT(R^2 + XL^2), I get the same results as PSpice for each stage separately.
6) The discrepancy appears to be when the two separate Z's are simply summed.
So I am trying to figure out the missing piece of how to compute (in Excel) the correct over all Z at 1000Hz to come up with 4.83 as the result, vs. the incorrect 6.3.
Any shared insight would be much appreciated. Thanks.
.99
I've been struggling for a while trying to figure out the discrepancy between what PSpice is plotting for an over all impedance plot (green trace) vs. the simple summation of the two individual (parallel RL) impedances (fuchsia trace) in a simulation where I have exported the results into Excel and plotted it there.
In reference to the attached impedance plot of two parallel RL sections in series (Re1 || Le1 + Re2 || Le2), I have labeled the Z's at 1000Hz for each trace. Fuchsia is simply the summation of the two separate Z's of each section (yellow stage 1, blue stage 2) while the green trace is the target trace that PSpice generates. PSpice also generated the 2 individual traces, yellow and blue.
At 1000Hz, the data is:
Z Lower (yellow) = 3.468
Z Upper (blue) = 2.8395
Z SUM (yellow + blue) = 6.3
Z SUM SIM = 4.83
Notes:
1) "Z SUM SIM" was generated by using a 1VAC input & with an "AC Sweep & Noise", and simply inverting the over all current being monitored between the source and first stage (1/i(in)). Result at 1kHz = 4.83
2) The two separate RL stage Z plots were generated by probing the differential voltage across each stage and dividing by the over all i(in).
3) "Z SUM" is simply (Z Lower) + (Z Upper). Result at 1kHz = 6.3
4) Using this equation in Excel: Z = R1R2/(R1 + R2 + j2piF*(L1R2 + L2R1 + L1L2))/(R1 + R2 + j2piF*(L1 + L2)), I get an over all Z result of 5.92 @ 49 degrees for both stages.
5) Using this equation in Excel for one stage: Z = R*XL / SQRT(R^2 + XL^2), I get the same results as PSpice for each stage separately.
6) The discrepancy appears to be when the two separate Z's are simply summed.
So I am trying to figure out the missing piece of how to compute (in Excel) the correct over all Z at 1000Hz to come up with 4.83 as the result, vs. the incorrect 6.3.
Any shared insight would be much appreciated. Thanks.
.99