wordings and abbreviations are a major task, especially in technical communication.What is a "sweep" ?
But, before going the ad hominem route it is better to just ask.
(Memo to myself) ;-)
And it's good to simply answer questions. Without looking for the malice of the question.
(Memo to myself) ;-)
Best regards
Bernd
Last edited:
Hi markbakk,
No, I was referring to the North American B&K, not Bruel and Kjaer.
I sold B&K, and Leader in the late 1970's. My second meter was a B&K 2800 (I think). They are better than the real cheap stuff, but not even close to HP, Fluke, Tektronix and other brands common in North America. My first digital meter was a Fluke 8200A with the resistance and AC voltage cards. Great meter, nixie tube display failed on all three I have. I started with a Heathkit IM-18 that I built. Still have that as well.
Hi tktran303,
As I said in a post before yours, it all depends on what you are after and how much importance and trust you place in your measurements. I learned on the test bench, in my living room for stereo, in the recording studios. You sure do not get something for nothing ... except sometimes you do not get what you paid for either.
Thank you for clearing up my reference to B&K David.
-Chris
No, I was referring to the North American B&K, not Bruel and Kjaer.
I sold B&K, and Leader in the late 1970's. My second meter was a B&K 2800 (I think). They are better than the real cheap stuff, but not even close to HP, Fluke, Tektronix and other brands common in North America. My first digital meter was a Fluke 8200A with the resistance and AC voltage cards. Great meter, nixie tube display failed on all three I have. I started with a Heathkit IM-18 that I built. Still have that as well.
Hi tktran303,
Market position has some influence, but not like it does with audio equipment. There are very real differences between test equipment brands compared to the cheap ones.it’s all relative.
You can get an automotive stethoscope
A nursing stethoscope
A doctor’s stethoscope
A cardiologist’s stethoscope
A digital stethoscope
Price difference can be a factor of 100
Can you listen to your cabinet vibrations with any/all of these?
Sure.
As I said in a post before yours, it all depends on what you are after and how much importance and trust you place in your measurements. I learned on the test bench, in my living room for stereo, in the recording studios. You sure do not get something for nothing ... except sometimes you do not get what you paid for either.
Thank you for clearing up my reference to B&K David.
-Chris
D
Deleted member 375592
I tried the method I described in the "Measurement mics" thread in real life.
The results:
1. Old method, as per Matlab 2019b release of non-literal implementation of A.Farina 2007. Sine sweep turned out to be a "Log Chirp" from pre-historic era. Deemp of -3dB/octave is due to log sweep.

2. New method, without noise RIR reduction. No deemp. Quite a difference on low frequencies.

3. Here I run into a problem with the denoising of harmonic responses: I do not know what is important and what is not.
Let's look at the Spk+Room main RIR spectrogram: You can not see the 2kHz 2nd harmonic presence in the RIR spectrogram. You won't see anything on the 3D waterfall either.

Now, let's look at the 2nd harmonic IR spectrogram: You can clearly see the long decaying tail on 4kHz. That means this driver rings on 2kHz with distortions for quite a long time.

Let's look at the 3rtd harmonic IR spectrogram. It is clear that the distortions do not follow exactly Xms after the main ridge, there is a blip delay at 7.5 kHz.

I am not sure if looking at further harmonics, like 4th, would be interesting for anyone except stubborn perfectionists:

As "Standard" subband denoising like EM-84 could throw away the details that may be important, I would like to ask for opinions on what information you would like to see, and what can be scrapped as noise.
Thanks,
Michael
The results:
1. Old method, as per Matlab 2019b release of non-literal implementation of A.Farina 2007. Sine sweep turned out to be a "Log Chirp" from pre-historic era. Deemp of -3dB/octave is due to log sweep.
2. New method, without noise RIR reduction. No deemp. Quite a difference on low frequencies.
3. Here I run into a problem with the denoising of harmonic responses: I do not know what is important and what is not.
Let's look at the Spk+Room main RIR spectrogram: You can not see the 2kHz 2nd harmonic presence in the RIR spectrogram. You won't see anything on the 3D waterfall either.
Now, let's look at the 2nd harmonic IR spectrogram: You can clearly see the long decaying tail on 4kHz. That means this driver rings on 2kHz with distortions for quite a long time.
Let's look at the 3rtd harmonic IR spectrogram. It is clear that the distortions do not follow exactly Xms after the main ridge, there is a blip delay at 7.5 kHz.
I am not sure if looking at further harmonics, like 4th, would be interesting for anyone except stubborn perfectionists:
As "Standard" subband denoising like EM-84 could throw away the details that may be important, I would like to ask for opinions on what information you would like to see, and what can be scrapped as noise.
Thanks,
Michael
Hallo Michael
Do not scrap the Barkhausen-noise.
https://purifi-audio.com/blog/tech-notes-1/this-thing-we-have-about-hysteresis-distortion-3
It is called "noise".
It sounds like "noise". (to uneducated ears 😉)
But it is not random like e.g. thermal noise.
Best regards
Bernd
I would like to ask for opinions on what information you would like to see, and what can be scrapped as noise.
Do not scrap the Barkhausen-noise.
https://purifi-audio.com/blog/tech-notes-1/this-thing-we-have-about-hysteresis-distortion-3
It is called "noise".
It sounds like "noise". (to uneducated ears 😉)
But it is not random like e.g. thermal noise.
Best regards
Bernd
Last edited:
Hi markbakk,
Here they are known by B&K, that's all. You are correct in that the full name is "BK Precision", I thought B&K Precision, but haven't looked in a very long time. I laugh at the word Precision. Leader was more accurate and better built. Neither come close to "real" test equipment.
Here they are known by B&K, that's all. You are correct in that the full name is "BK Precision", I thought B&K Precision, but haven't looked in a very long time. I laugh at the word Precision. Leader was more accurate and better built. Neither come close to "real" test equipment.
D
Deleted member 375592
Hi Bernd,Do not scrap the Barkhausen-noise.
Best regards
Bernd
AFAIK, sine sweep does not help with Barkhausen noise. You'll need to use my FSAF-based method, described in the "midrange measurement" thread, on real music.
MarkBakk,
If you want to get minimal noise FR and harmonic estimates for midrange drivers, you can apply a quasi-anechoic gated response approach, and you'll get
If this is what you want... here you are!
B&K means Bruel & Kiaer, https://www.bksv.com/en
D
Deleted member 375592
For comparison, same spk, same level, but recorded with ECM8000 which has 25dB higher self-noise.
The spectrogram:

...processed with Old Method:

and with New method:

The spectrogram:
...processed with Old Method:
and with New method:
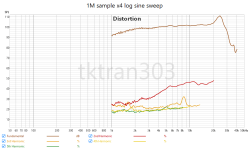
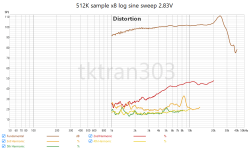
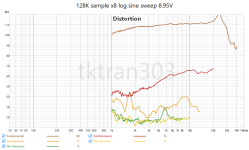
It is now clear that the best use of time is one, extended sweep rather than multiple sweeps.... sine sweeps, and/or the use of multiple sweeps to reduce the noise floor?
If so, I have some data that I could share. Perhaps @Dave Zan could enlighten me as to when I need/not need to use them.
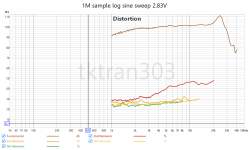
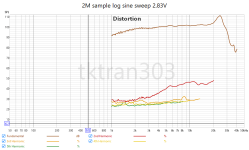
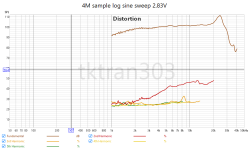
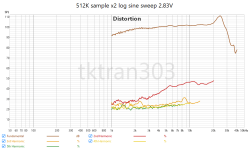
For example, a 4M point sweep will outperform 4 summed 1M sweeps and take no more time, or less because of start-up overheads.
Multiple summed sweeps may have been a useful work-around in the days of slower CPUs and more limited memory but are now mostly obsolete.
Best wishes
David
Hi BerndDo not scrap the Barkhausen-noise.
https://purifi-audio.com/blog/tech-notes-1/this-thing-we-have-about-hysteresis-distortion-3
The PuriFi note isn't about Barkhausen noise, hysteresis is related but different.
Is there any evidence that Barkhausen noise is audible?
I have seen it raised in "audiophile" discussion, so I'm a little suspicious, but curious.
Best wishes
David
My previous post was written before you added the visuals so I've asked for it to be deleted.That’s not what my preliminary data shows…
Now I'm surprised and confused, it does look like the summed shorter sweeps perform better than the equivalent extended sweep.
All I can think of at the moment is some kind of numerical precision artifact, that the summed sweeps allow for overflow and use double precision or some similar implementation issue in the code.
Or I misunderstand the Farina paper (or Farina messed up 😉 ).
In any case, my compliments on your careful work, I'm keen to see if anyone has a better explanation.
Best wishes
David
That’s not what my preliminary data shows…
Let me know what you think.
It would interesting to see those plots with the "Mask harmonics below noise floor" option enabled. Or compare the noise floor alone between the single vs multiple sweeps.
9 lies to choose fromLet me know what you think.
Ask audiophileslittle suspicious, but curious.
Found it after all, answer/comment laterin the "midrange measurement" thread
I hear you.9 lies to choose from
1 ultra low distortion tweeter will be sacrificed to the STEPS sine gods in the name of science.
The original post was about S/N and if you get valid measurement data. It's always about the noise you get in your measurement. Checking the noisefloor - OF YOUR MEASUREMENT. Of course you have to do it with your specific analysis cause it influences the sensitivity to noise a lot. As shown here.To me, "checking the noisefloor" seemed like one would record the noise to check how much there is and what it looks like. I don't see the point of applying filters or of deconvolving it with the (inexistent) test signal.
Sorry I really don't know how to explain that differently/more easy.
Otherwise you would do an environmental analysis of the acoustical noise, would use weighting and time averaging, Leq measurements etc ... something pretty different! But that's not the noisefloor of ... your measurement ;-) that's the perceived acoustical noise in your room which limits hearing. And as you see with my graphs that's by far not the same!
I refered to MLS-Signal. Sorry we use these terms and letters differently in German language ... it's a pain and sometimes some terms slip through.MLS is usually Maximum Length Sequence and MLSSA is an MLS based Software Analyser or some similar acronym.
I am not sure which one you mean by MLSS, if either?
In either case it's not a continuous sweep so I don't understand your comment... is it a typo?
MLS needs FFT to get to your data.
A continuous sweep ("chirp", exponentional sine sweep, ... different names for the same thing) needs SIMILAR math (Fourier Transformations) to get to your impulse response and the rest of the data and has similar restrictions (longer FFT sizw gives more LF resolution but bigger data sizes etc). It has the advantage over a MLS signal (which is similar to white noise) that you get more energy in the measurement frequencies - little better S/N.
https://en.wikipedia.org/wiki/Maximum_length_sequence
https://www.ap.com/technical-library/more-about-impulse-response/
https://www.ni.com/docs/de-DE/bundl...t/page/svtconcepts/lvac_continuous_sweep.html
Sorry I have no idea what you are referring to here?
Averaging and longer sequence length is the way to statistically reduce noise. It adds SNR to your "basic" SNR of your measurements but takes time and processing power.
What is a "sweep" ?
Your sweep question got answered 2-3 times - is there anything open to talk about?And it's good to simply answer questions. Without looking for the malice of the question.
(Memo to myself) ;-)
- Home
- Loudspeakers
- Multi-Way
- Noise sensitivity of different measurement algorithms - graphs
