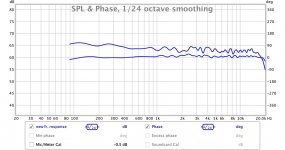
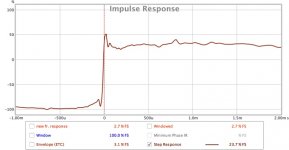
Amplitude curve looks correct, featuring the two sharp dips as expected.
Phase curve looks correct at first glance, with the medium showing at 180 degree, phase reverse, as you deliberately wired it.
Problem is the 3 kHz to 15 kHz zone (covering a lot of energy), the phase showing a horizontal plateau at + 45 degree.
IMO, something went wrong in the FIR filter, that's doing the phase equalization.
The evil can happen at design time, and/or can happen at execution time.
At design time, a common error is a time mismatch caused by a wrong assessment of the beginning of the impulse response, when it is done manually. It needs to be done manually, for compensating the speaker-to-mike sound travel time (1 meter is approx 3 ms), and also, for compensating the FIR filter transit time (in the order of 10 ms, as such FIR filter is supposed to render a non-minimal phase system, into a linear phase system). Moreover, in case the FFT analyzer is a simplified dual-channel FFT analyzer (featuring a digital loopback instead of a proper analog loopback), one need to compensate the ADC, DAC, operating system latency and USB latency that can add 30 ms or more, together.
Problem is, as soon as you mess with such delay compensation, your phase curve becomes sloped, and difficult to interpret. Thus, even in case there is a delay compensation error at design time, you are not supposed to get a phase curve exhibiting such +45 degree horizontal plateau from 3 kHz to 15 kHz.
IMO, the error that's in the FIR filter departs from a delay compensation error at design time.
Need to concentrate thus, on a possible FIR filter error at execution time.
Would be interesting, to redo the gain, phase and step response measurement after disabling the FIR filter that's in charge of the gain and phase equalization. You know you have correctly compensated all above delays, when you see the 3 kHz to 10 kHz phase curve becoming horizontal, centered on the 0 degree line. From there, as soon as you move the mike (or slightly de-tune the delay compensation), you'll see the phase curve exhibiting a slope in the 5 kHz to 15 kHz region, positive slope or negative slope depending on delay under-compensation or over-compensation. In other words, you should never see a phase that's remaining horizontal, at say +45 degree or at say - 45 degree.
Let's continue discussing about a possible FIR filter error at execution time.
Possibly, the FIR filter that's executing is longer than what you think, the last coefficients possibly coming from a previous experiment.
Possibly, the windowing function you are applying is shorter than the FIR filter. Again, the last FIR filter coefficients will cause trouble.
Possibly, the windowing function is of symmetrical type, which may not be appropriate to a FIR filter aiming at transforming a non-minimal phase system, into a linear phase system.
As consequence, what's regarding the FIR filter :
1 - try disabling the windowing,
2 - make sure the FIR filter that gets executed, has all coefficients properly defined (no random data around the end),
3 - as last resource, try disabling the whole FIR filter,
4 - and redo the delay compensation whenever required, with great precision
Regards,
Steph
Last edited:
Steph the phase from about 2k and after is around 0 degrees all the time. Maybe you confuse the fr. response because these graphs are both in same blue color?
From your experience will i see any differences if i'll use other impulse windowing or optimization for the FIR filter?
From your experience will i see any differences if i'll use other impulse windowing or optimization for the FIR filter?
You are absolutely right. Sorry. I should not have replied in a hurry.Steph the phase from about 2k and after is around 0 degrees all the time. Maybe you confuse the fr. response because these graphs are both in same blue color?
I think so, therefore I proposed those incremental changes about the FIR filter : check if the FIR execution has valid coefficients same length as the FIR design, check if the windowing design has a valid length, check if the windows type that got chosen makes sense in our context, and finally, have a try disabling the FIR execution. And always, be very careful what's concerning the delay compensation.From your experience will i see any differences if i'll use other impulse windowing or optimization for the FIR filter?
P.S. I'm again in a hurry.
yesterday after some measurements-changes (mostly time delays in low-mid sections) i now have these results. I cannot say that there is any difference in sound.
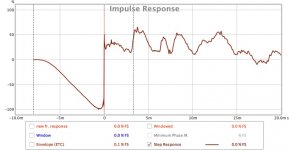
is this step response any better than the previous one?
is this step response any better than the previous one?
Attachments
Last edited:
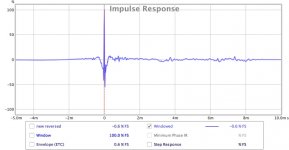
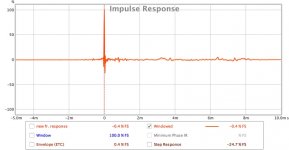
Such measurement batch appears somewhat inconsistent to me. I understand that you want to compare the "normal" medium setup against the "reversed" medium setup. I see that this time, you measured an impulse response (Dirac) what's regarding the "normal" medium setup.
- Can you please show the -5 ms to + 10 ms of the impulse response (Dirac) of the "normal" medium setup?
- Can you please show the -5 ms to + 10 ms of the impulse response (Dirac) of the "reversed" medium setup?
Then, we may take a pen and a paper, for computing both theoretical step responses.
- Can you please show the -5 ms to + 10 ms of the impulse response (Dirac) of the "normal" medium setup?
- Can you please show the -5 ms to + 10 ms of the impulse response (Dirac) of the "reversed" medium setup?
Then, we may take a pen and a paper, for computing both theoretical step responses.
Last edited:
if i understand right you want to see these impulse responses? Is the step i posted in the previous post (#45) somehow better than the previous one (#38)?
Attachments
Last edited:
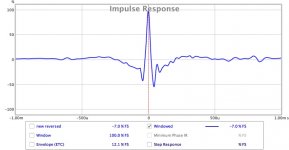
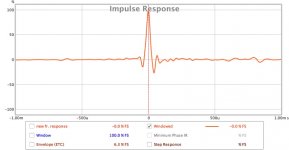
Wow ! Truly amazing. This is now perfectly consistent. This is the best impulse response I've seen from a 3-way speaker (speaking of the red curve). The blue curve (reverse phase medium) indicates that this is real stuff, obeying the physics. I can understand your satisfaction when listening to the music.
Can I please see the two impulse responses, in the -1 ms to +2 ms interval? I guess I'll be able to detail the big rise, immediately followed by the big fall, and hopefully no garbage in-between.
As soon as I get this, I can take a pen and paper (or Excel) for convolving this with a step, for showing you the theoretical step response. Or perhaps, you are willing to do it, as exercise?
Congratulation, you've succeed in what I have tried about ten years ago with PIC32 microcontrollers (first generation, unbuffered and buffered SPI, no audio mode), then more recently with the first ARM Cortex-M4 microcontrollers featuring I2S like Freescale Kinetis, however knowing by advance they are not fast enough for executing long FIR filters even 44.1 kHz. More recently, I tried with STM32F4 and STM32F7, much faster but not yet ideal. During all those years, I lost focus about Sharc processors, remaining unaware of those new and inexpensive 400 MHz Sharc processors featuring ample internal RAM, to be exploited as one-chip.
In the meantime, I developed the idea of self-adjusting FIR filters (and necessary ancillaries), that I successfully prototyped using Flowstone on a Windows PC.
In your system, there is no guarantee that each speaker driver exactly delivers an equalized transfer function equal to the 8th-order Linkwitz-Riley you have targeted. Your ears and brain may get a better satisfaction, by ensuring that each individual speaker driver gets equalized and filtered by a FIR filter, so that each individual speaker driver exactly delivers an equalized transfer function equal to the 8th-order Linkwitz-Riley you have targeted.
Because of this, later on, we shall have a look of the individual speaker curves, after the IIR Biquad filtering doing the Linkwitz-Riley, but before the FIR filter that's in charge of the global amplitude and phase equalization.
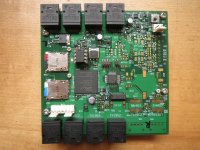
yes, it seems that the minisharc board with its SHARC is a good start for someone who knows what to do with it. I must say that designing the circuit was not easy and it is a very time consuming project. But the results are worth it. Look at the step and impulse you wanted in smaller time scale.
I had tried before (when i was designing my active analog filters) the minidsp 2x4 with its IIR filters. I must say that i was not impressed with it (sound quality, noise) - the analog was surely better. I used the minidsp only for testing different frequencies / slopes. Now with this board the sound is much better - completely different to my ears (bass, voices) comparing to my good analog active crossover.
Steph have you succesfully tried a FIR computer based crossover? I think the pc based will have more processing power?
The IIR filters and driver eq was developed by measuring and simulating many times (same way when i was making the analog cross but with stepper slopes). Each driver , after the 48db LR filter and after the driver amplitude equalization, is acustically following almost perfectly the LR48db response. With only the LR filter they are not following exactly. These drivers have many response irregularities because of their metallic cones. (seas excel drivers)
Attachments

Last edited:
The red curves (in-phase medium) are consistent.
The blue curves (reverse medium) are consistent.
But wait a minute.
Isn't any loudspeaker, a highpass system?
Yes, all loudspeakers are highpass systems.
1. They cannot change the long term atmospheric pressure, unless you listen to them inside a pocked submarine.
2. Because of the cone suspension stiffness (spring effect), and the cone mass, any closed box behaves as a 2nd-order highpass, say -3 dB at 40 Hz best case (need a large enclosure), even listened inside a pocket submarine.
3. The electret mike is also behaving as a highpass, because of the electrical resistance that's loading the moving capacitor plate (membrane) used as sensor.
4. And, between the mike preamp and the ADC that's digitizing the mike signal, there is at least one coupling capacitor.
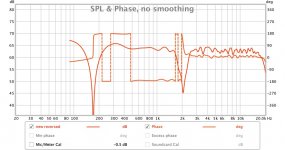
Now look the red (in-phase medium) Dirac response (3rd graph above).
Clearly, the area (integral) under the curve is different from zero. The negative surfaces at both sides don't compensate the big positive surface that's under the peak.
Thus, according to such impulse response curve, the speaker doesn't behave as a highpass.
In case your FFT analyzer tells the truth, one can imagine that the FIR filter that you have implemented as gain and phase equalizer, operates as bass booster under 50 Hz, for exactly compensating the highpass nature of the speaker, mike and coupling capacitors. It thus boosts the 40 Hz by 3 dB, 20 Hz by 6 dB, 10 Hz by 12 dB, 5 Hz by 18 dB, and so on.
Let's consider a 4,410 tap FIR filter. A SHARC DSP clocked at 400 MHz should be fast enough for executing it a 44.1 kHz sampling frequency, on two audio channels at the same time. The spectral resolution is 10 Hz. The FIR filter should be able to tailor the response curve, like an analog equalizer having 2,206 pots. The first pot governs the DC to 5 Hz band. The second pot governs the 5 Hz to 15 Hz band. The third pot governs the 15 Hz to 25 Hz band, and so on, until the last pot covering the 22,025 Hz to 22,050 Hz band. It is thus not foolish to expect such long FIR filter, to act as bass booster. Good news !
As you can see, the first and last frequency bands are half-width. Consequently, the measured energy over there is half what's expected, compared to the intermediate frequency bands. Most people forget this. They hand-code their FFT routine in a proper way, but they forget about doubling the sensitivity of the energy detectors that are connected on the first and last frequency bins. In case they base on a third-party FFT library whose source code is unknown, comes the question to know if the extra job about the first and last bin, is done or left to the user. When they are in doubt, they simply drop the first and last bands, considering that 5 Hz is below the audio band, and considering that 22,025 Hz is outside the audio band. They reduce the display, only showing the 5 Hz to 22,025 Hz zone. Now you know everything about the FFT, FFT analyzers, and FIR filters.
Your FFT analyzer may not tell the truth, not because of the above complication, but because of relying on a FFT lenght, shorter than your FIR filter length. In case your FFT analyzer is relying on a 1024-samples FFT at 44.1 kHz, it only can resolve 43 Hz. The first frequency band is DC to 21.5 Hz. The second frequency band is 21.5 Hz to 64.5 Hz. In case your FFT analyzer is the kind of guy, dropping the first frequency band, it doesn't get the fine vision of what's really happening between 21.5 Hz and 64.5 Hz, and it is blind for everything below 21.5 Hz. Unfortunately, for computing the impulse response (Dirac) and for computing the step response, your FFT analyzer is computing an inverse FFT, and for being exact, the first frequency band (DC to 21.5 Hz) is required. Now imagine what's happening in case the inverse FFT is exploiting some invented data, averaged data, what's concerning the first frequency band. It may tell that the system is able to pass DC. It may show a Dirac (impulse response) containing DC.
Now, combine all above difficulties with the fact that while doing audio measurements, one must ensure a rich spectral content, for the FFT analyzer getting food at all frequencies. Most FFT analyzers rely on a MLS or on a white noise. The problem with those test signals, is that they contain the same energy, for a given bandwidth. Take the 10,000 Hz to 10,050 Hz band. It will contain the same energy as the 100 Hz to 150 Hz band. That's inappropriate. Who cares about 50 Hz at 10,000 Hz, when the measurement is done for clarifying what's happening in the low frequencies. There is a waste of resource there. The testing energy gets allocated to the wrong frequency band. When measuring an audio system in wideband, say from 20 Hz to 20 kHz using a FFT, it is better to use a pink noise, where there is the same energy, per octave (or per decade). In a pink noise signal, there is the same energy in the 25 Hz to 50 Hz band, as in the 2,500 to 5,000 Hz band. Which means that now, the signal/noise of the measurement has dramatically improved in the low frequencies.
Imagine now what can happen when the measurement is made using a white noise. The signal is dominated by high frequencies. The low frequencies are buried. The FFT analyzer has a great difficulty, grabbing bits and pieces of low frequencies. The error will be huge in the low frequencies. Low frequencies mean a wide time scale when the inverse FFT gets applied for computing the impulse (Dirac) or step response. Both sides of the impulse response may get corrupt, displaying non-existing time-domain responses widely spanning around the main response peak. Bear in mind that a 100 Hz frequency has a 10 ms period. In case there is a fiddle about the 100 Hz frequency, it is not going to show as a highly localized peak, but as as some wide soft thing, 10 ms wide.
Now imagine there is some 100 Hz hum entering your system, polluting the mike signal. In case there is not enough FFT averaging for wiping it out, the parasitic 100 Hz hum will dominate the true low frequency energy, especially in case the spectral allocation is bad like when using a white noise as test signal.
Now, imagine there is some light digital saturation occurring somewhere in the system. This will also lead to absurd measured curves. It will show as wideband noise, even more masking the true low frequency energy in case the spectral allocation is bad like when using a white noise as test signal.
It gets worse in case the speaker is producing distortion. The frequency response is obtained by the computation, frequency band per frequency band, of the mike signal spectrum, divided by the test signal spectrum. Now imagine your woofer, delivering a high distortion at 20 Hz. There will be a strong harmonic, say a 3rd harmonic at 60 Hz. At the same time, it can happen that the instantaneous spectral content of the test signal, is nearly zero at 60 Hz. Consequently, the 60 Hz out / in ratio will dramatically increase. Your frequency response curve will overestimate the frequency response at 60 Hz.
I suggest measuring the frequency response and the phase response using another 2-channel FFT analyzer, having less bells and whistles, and still giving you total control on what's essential. This is spectraLab 4.32. It also contains a pink noise generator. You can download it from : spectralab 4.32 Service Manual free download,schematics,datasheets,eeprom bins,pcb,repair info for test equipment and electronics
Regards,
Steph
The blue curves (reverse medium) are consistent.
But wait a minute.
Isn't any loudspeaker, a highpass system?
Yes, all loudspeakers are highpass systems.
1. They cannot change the long term atmospheric pressure, unless you listen to them inside a pocked submarine.
2. Because of the cone suspension stiffness (spring effect), and the cone mass, any closed box behaves as a 2nd-order highpass, say -3 dB at 40 Hz best case (need a large enclosure), even listened inside a pocket submarine.
3. The electret mike is also behaving as a highpass, because of the electrical resistance that's loading the moving capacitor plate (membrane) used as sensor.
4. And, between the mike preamp and the ADC that's digitizing the mike signal, there is at least one coupling capacitor.
Now look the red (in-phase medium) Dirac response (3rd graph above).
Clearly, the area (integral) under the curve is different from zero. The negative surfaces at both sides don't compensate the big positive surface that's under the peak.
Thus, according to such impulse response curve, the speaker doesn't behave as a highpass.
In case your FFT analyzer tells the truth, one can imagine that the FIR filter that you have implemented as gain and phase equalizer, operates as bass booster under 50 Hz, for exactly compensating the highpass nature of the speaker, mike and coupling capacitors. It thus boosts the 40 Hz by 3 dB, 20 Hz by 6 dB, 10 Hz by 12 dB, 5 Hz by 18 dB, and so on.
Let's consider a 4,410 tap FIR filter. A SHARC DSP clocked at 400 MHz should be fast enough for executing it a 44.1 kHz sampling frequency, on two audio channels at the same time. The spectral resolution is 10 Hz. The FIR filter should be able to tailor the response curve, like an analog equalizer having 2,206 pots. The first pot governs the DC to 5 Hz band. The second pot governs the 5 Hz to 15 Hz band. The third pot governs the 15 Hz to 25 Hz band, and so on, until the last pot covering the 22,025 Hz to 22,050 Hz band. It is thus not foolish to expect such long FIR filter, to act as bass booster. Good news !
As you can see, the first and last frequency bands are half-width. Consequently, the measured energy over there is half what's expected, compared to the intermediate frequency bands. Most people forget this. They hand-code their FFT routine in a proper way, but they forget about doubling the sensitivity of the energy detectors that are connected on the first and last frequency bins. In case they base on a third-party FFT library whose source code is unknown, comes the question to know if the extra job about the first and last bin, is done or left to the user. When they are in doubt, they simply drop the first and last bands, considering that 5 Hz is below the audio band, and considering that 22,025 Hz is outside the audio band. They reduce the display, only showing the 5 Hz to 22,025 Hz zone. Now you know everything about the FFT, FFT analyzers, and FIR filters.
Your FFT analyzer may not tell the truth, not because of the above complication, but because of relying on a FFT lenght, shorter than your FIR filter length. In case your FFT analyzer is relying on a 1024-samples FFT at 44.1 kHz, it only can resolve 43 Hz. The first frequency band is DC to 21.5 Hz. The second frequency band is 21.5 Hz to 64.5 Hz. In case your FFT analyzer is the kind of guy, dropping the first frequency band, it doesn't get the fine vision of what's really happening between 21.5 Hz and 64.5 Hz, and it is blind for everything below 21.5 Hz. Unfortunately, for computing the impulse response (Dirac) and for computing the step response, your FFT analyzer is computing an inverse FFT, and for being exact, the first frequency band (DC to 21.5 Hz) is required. Now imagine what's happening in case the inverse FFT is exploiting some invented data, averaged data, what's concerning the first frequency band. It may tell that the system is able to pass DC. It may show a Dirac (impulse response) containing DC.
Now, combine all above difficulties with the fact that while doing audio measurements, one must ensure a rich spectral content, for the FFT analyzer getting food at all frequencies. Most FFT analyzers rely on a MLS or on a white noise. The problem with those test signals, is that they contain the same energy, for a given bandwidth. Take the 10,000 Hz to 10,050 Hz band. It will contain the same energy as the 100 Hz to 150 Hz band. That's inappropriate. Who cares about 50 Hz at 10,000 Hz, when the measurement is done for clarifying what's happening in the low frequencies. There is a waste of resource there. The testing energy gets allocated to the wrong frequency band. When measuring an audio system in wideband, say from 20 Hz to 20 kHz using a FFT, it is better to use a pink noise, where there is the same energy, per octave (or per decade). In a pink noise signal, there is the same energy in the 25 Hz to 50 Hz band, as in the 2,500 to 5,000 Hz band. Which means that now, the signal/noise of the measurement has dramatically improved in the low frequencies.
Imagine now what can happen when the measurement is made using a white noise. The signal is dominated by high frequencies. The low frequencies are buried. The FFT analyzer has a great difficulty, grabbing bits and pieces of low frequencies. The error will be huge in the low frequencies. Low frequencies mean a wide time scale when the inverse FFT gets applied for computing the impulse (Dirac) or step response. Both sides of the impulse response may get corrupt, displaying non-existing time-domain responses widely spanning around the main response peak. Bear in mind that a 100 Hz frequency has a 10 ms period. In case there is a fiddle about the 100 Hz frequency, it is not going to show as a highly localized peak, but as as some wide soft thing, 10 ms wide.
Now imagine there is some 100 Hz hum entering your system, polluting the mike signal. In case there is not enough FFT averaging for wiping it out, the parasitic 100 Hz hum will dominate the true low frequency energy, especially in case the spectral allocation is bad like when using a white noise as test signal.
Now, imagine there is some light digital saturation occurring somewhere in the system. This will also lead to absurd measured curves. It will show as wideband noise, even more masking the true low frequency energy in case the spectral allocation is bad like when using a white noise as test signal.
It gets worse in case the speaker is producing distortion. The frequency response is obtained by the computation, frequency band per frequency band, of the mike signal spectrum, divided by the test signal spectrum. Now imagine your woofer, delivering a high distortion at 20 Hz. There will be a strong harmonic, say a 3rd harmonic at 60 Hz. At the same time, it can happen that the instantaneous spectral content of the test signal, is nearly zero at 60 Hz. Consequently, the 60 Hz out / in ratio will dramatically increase. Your frequency response curve will overestimate the frequency response at 60 Hz.
I suggest measuring the frequency response and the phase response using another 2-channel FFT analyzer, having less bells and whistles, and still giving you total control on what's essential. This is spectraLab 4.32. It also contains a pink noise generator. You can download it from : spectralab 4.32 Service Manual free download,schematics,datasheets,eeprom bins,pcb,repair info for test equipment and electronics
Regards,
Steph
Last edited:
Yes, as I wrote, I've done it several years ago, basing on Flowstone. I never fiddled with RePhase and the like. I immediately jumped on the self-adjusting FIR filter. In such system based on Flowstone, the PC is doing the FFT, averaging, inverse FFT, FIR coefficients computation, impulse response computation, in realtime and continuously, while at the same time it is executing the FIR filter, and also plotting the frequency response curve, phase response curve, and impulse response. I also added a time-domain display, kind of oscilloscope.Steph have you succesfully tried a FIR computer based crossover? I think the pc based will have more processing power?
If I remember, the maximum FIR filter length was 256 samples.
You can see this here : DSP Robotics Support • View topic - Speaker Lab
If I remember, the maximum FIR filter length of 256 samples was due to some limitation in the x86 FPU assembly code of the FIR filter routine. Such FIR filter routine got written in x86 FPU assembly code, not by myself, but by some remarkable fellow on Flowstone, specialist on x86 FPU assembly code. There are no "if" instructions. You are required to do the branching using condition codes. And, from what I remember, getting the equivalent of a data pointer is not trivial. I never succeeded in understanding the assembly code of such FIR filter.
An ideal FIR filter for audio is the audio data in 24-bit fixed point, the coefficients data in 24-bit fixed point, forming a 48-bit word after a fixed point multiplication, that's accumulating into a 64-bit register. This enables true 24-bit FIR filters up to 65,536 taps, without risking saturation, and without losing a single bit of resolution.
Speaking about the speed, I don't know if this feasible on a PC, at audio sampling frequencies like 44.1 kHz and 48 kHz.
Speaking about the precision, I don't know if this is feasible on a PC, as the x86 arithmetic coprocessors, are floating point (FPU) instead of fixed point.
I also experimented with Frequency Warped FIR filters.
You can see this here : DSP Robotics Support • View topic - time-domain FIR filter (Convolver)
Kind of logarithmic spectral resolution. Enables a quite short FIR filter to provide a sharp spectral resolution in the low frequencies, and coarse spectral resolution in the high frequencies. Price to be paid is a huge phase distortion. You won't like.
One trick for implementing long FIR filters featuring say 2,000 taps and more, is to operate a FFT, then do the filter in frequency domain (additions only), then operate an inverse FFT. This way, a plain normal PC can execute a few 65,536-tap FIR filters, at a 44.1 kHz sampling frequency.
Some people don't like it because of the trigonometric coefficients involved, introducing a third granularity, the two first ones being the audio data granularity and the coefficients data granularity.
In practice, the resulting error is a few orders of magnitude less than a loudspeaker driver error, as any loudspeaker driver is always plagued by distortion, no matter the size, the shape, the material and the cost.
Cheers,
Steph
Last edited:
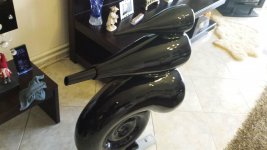
One now gets interested in the speakers. Would you care to described them a bit and post some pictures please? And what was the distance for your impulse measurements?
//
//
yes, they are 3 way speakers with the W26fx001, w15ch001, t29cf002 seas excel units. The front baffle is not flat as you can see from the photos. The mid and woofer cabinet are closed type almost conical shape. The cabinets are made from fiberglass (woofer cabinet is1.6mm thick!). They are filled with wool - the position - quantity required was determined using response measuring. All the measurements are made at the tweeter level 1m from the tweeter front plate. The only delays i used in the FIR filters are needed because of the Fir filter different lenghts. (on the analog active cross i have no delay in the tweeter or midrange because the drivers are already physically aligned on Z axis). They are crossed digitally now (IIR) at 180hz and 1,980Hz LR 8th order. Maybe i will try to cross the tweeter little lower with the same slope. With the analog active cross they were crossed at 250hz and 2200Hz LR 2nd order.
Attachments
Hi ioannidis, are you aware of the various methods that are on the market nowadays for *estimating* an Impulse Response, using a single-channel analyzer ?
- MLS
- IRS
- Time-Streched pules
- Farina's SineSweep
REW (Room Eq Wizard) the Room Acoustics Software you appear to use, relies on the Farina's SineSweep method.
https://www.roomeqwizard.com/
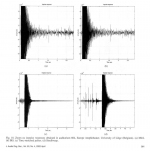
I'm attaching a picture, so you can judge. This is coming from the classic AES paper dating back from April 2002, entitled "Comparison of Different Impulse Response Measurement Technique".
http://www.bg.ic.ac.uk/research/g.stan/JAES_Online_version.pdf
Let me say I disagree about the term "Measurement" in the title. This is not "Measurement". This is "Estimate". This explains why each different method, delivers a different Impulse Response as result. Moreover, the AES paper title should have specified that all this literature is about estimating an Impulse Response using a single-channel analyzer, a task that's far from trivial, compared to the well tried and tested method using a two-channel analyzer.
The environment has changed since April 2002.
Fifteen years later, now in 2017, tanks to nowadays dualcore gigahertz Windows PCs, as soon as you are working on a speaker and/or digital audio processing software, you better use a genuine 2-channel analyzer like SpectraLab4.32 continuously working in realtime (menu mode RealTime) properly configured (menu config load TRANSFER).
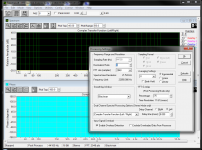
I am attaching a screenshot of SpectraLab4.32, configured this way.
Using a 44.1 kHz sampling frequency and a 2048 samples FFT size, the spectral resolution is 21.5 Hz, sharp enough for determining if the speaker bass rendering is good.
I insist on the fact that SpectraLab4.32 configured this way, is continuously working in realtime as soon as you click the "Run" (top left) icon. SpectraLab4.32 updates the PC screen several times per second, enabling to see what's happening to the frequency response curve and phase curve, as soon as you move the mike, move the speaker, re-orient the tweeter, add some mechanical offset to the tweeter, etc.
As soon as the speaker and/or DSP software is okay, doing what it is intended for, you may rely on REW, configuring REW (menu AnalysisPreferences - you must reed this thoroughly) for REW to deliver a frequency response and a phase response that are consistent with what SpectraLab says.
https://www.roomeqwizard.com/help/help_en-GB/html/analysis.html
REW is a powerful analyzer beautifully engineered, sending a couple of SineSweep signals in a row, averaging the response from the speaker, then making smart computations for displaying a lot of useful curves arranged in numerous tabs. One can ask for a new measurement by clicking the "Measure" (top left) icon. You shall look at the harmonic distortion curves up to the 10th harmonic, that are coming fee of charge thanks to Farina's remarkable work. And, you shall also look to the windowed impulse response and windowed step response that REW has computed (pay attention to the checkboxes over there), that are only meaningful about the speaker, at the condition that room reflections are kept minimal. Please remember that REW is a "Room EQ wizard". Through the impulse response and step response, REW helps you visualizing the short-term behavior of the speaker, and the room reflections coming soon after, progressively dominating the long-term speaker response. Please remember that REW, as measuring software, is not supposed to annihilate the room reflections. Actually it rejects the late room reflections to some extend through the time window, to be configured in the Preferences menu - Preferences - Analysis tab, and the simplified tab that's popping when clicking on the "IR Windows" icon (top mid). With REW, by conducting a 256k audio samples SineSweep (44.1 kHz sampling frequency) taking up to 5.9 second, comes the possibility of getting contaminated by very late room reflections. The adjustable time window enables to put the focus on some time period where it is assumed that the speaker response dominates the room reflections. By clicking on the "IR Windows" icon (top mid), one gets a tab enabling to adjust the time window start and end, and also define what's to be considered as the "zero time" (paramount for getting a phase curve that's exact). By clicking on the "Apply Windows to All" icon, the gain and phase curves get updated.
Playing with this will make you understand why and how REW gain and phase curves, may differ from SpectraLab gain and phase curves. With SpectraLab, the time windows length is always equal to the FFT length. Consequently, room reflections frequencies having a period that's correlated to the FFT length will be exacerbated by SpectraLab.
I deeply regret that SpectraLab doesn't offer the possibility to display the computed impulse response that's at the origin of the displayed gain and phase curve. One could have identified glitches in the impulse response extinction, signature of the room modes that are correlated to the FFT length.
Speaking of distortion, as soon as there is a heavy distortion (say more than 10%), the SpectraLab frequency curve will get biased to some extend. SpectraLab computes in the frequency domain, the out/in value, with the "in" being the white noise signal, and the "out" being the mike signal. Let's concentrate on the 100 Hz signal that's buried into the pink noise signal. The mike will pickup some 100 Hz along with some 200 Hz (2nd-harmonic) and 300 Hz (3rd-harmonic). Whatever the distortion percentage, Spectralab will display the correct 100 Hz gain. Unfortunately, SpectraLab cannot make a difference between some 300 Hz coming from the above distorted 100 Hz, and some 300 Hz that's coming from the 300 Hz that's buried into the pink noise signal. As consequence, the SpectraLab gain curve will exaggerate the 300 Hz gain by approx 1dB (the 10% extra). Provided we know, we can live with that.
Now imagine the room to be noisy. Which means that the mike will pickup some frequency content, that's uncorrelated to the pink noise used as stimulus. You will conclude that again, SpectraLab won't be able to discriminate the room noise, from the speaker response. You are right.
If you whistle while SpectraLab is running, you'll see the response curve developing a high peak at the frequency you are whistling.
Now consider the SpectraLab F4 shortcut, and look the various modalities you can select select what's regarding the "Dual Channel Spectral Function Options" :
- Real Transfer Function
- Cross Spectrum
- Complex Transfer Function
- Coherence Function
- and also Complex Transfer and Coherence on a same page
Impressive! By proper use of the above modalities, by comparing what they tell, and by trying different FFT lengths also, you get help for knowing if your measurement session is clean, or facing heavy distortion, of facing intense room reverberation, of facing intense noise from the room, not to forget a whistler possibly.
As a footnote, I'll say that SpectraLab gain and phase curves earn my preference, as they exhibit the kind of "fine grass" (kind of noise) appreciated by engineers and experts, telling if the underlying measurement session was clean or not.
As you dare dealing with the roots (PCB design hosting a Sharc DSP and various input/outputs, DSP software design), you shall deal with the roots what's regarding audio testing. Please get a decent USB soundcard featuring two line inputs and two line outputs. Let SpectraLab generate the pink noise signal. Use a "T" RCA adapter at the output of the soundcard for connecting 1) a RCA cable wire going to your speaker (analog input required !) and 2) a RCA cable returning to the right audio input (considered as reference). Connect the left audio input to some amplified measurement mike.
Or, possibly, in case you program a pink noise generator in the Sharc DSP, and in case the Sharc DSP can output such pink noise signal in analog form, you may let SpectraLab work in a passive way, not in charge of outputting the pink noise signal. SpectraLab will grab both audio signals (reference and mike), and will work just as usual.
- MLS
- IRS
- Time-Streched pules
- Farina's SineSweep
REW (Room Eq Wizard) the Room Acoustics Software you appear to use, relies on the Farina's SineSweep method.
https://www.roomeqwizard.com/
I'm attaching a picture, so you can judge. This is coming from the classic AES paper dating back from April 2002, entitled "Comparison of Different Impulse Response Measurement Technique".
http://www.bg.ic.ac.uk/research/g.stan/JAES_Online_version.pdf
Let me say I disagree about the term "Measurement" in the title. This is not "Measurement". This is "Estimate". This explains why each different method, delivers a different Impulse Response as result. Moreover, the AES paper title should have specified that all this literature is about estimating an Impulse Response using a single-channel analyzer, a task that's far from trivial, compared to the well tried and tested method using a two-channel analyzer.
The environment has changed since April 2002.
Fifteen years later, now in 2017, tanks to nowadays dualcore gigahertz Windows PCs, as soon as you are working on a speaker and/or digital audio processing software, you better use a genuine 2-channel analyzer like SpectraLab4.32 continuously working in realtime (menu mode RealTime) properly configured (menu config load TRANSFER).
I am attaching a screenshot of SpectraLab4.32, configured this way.
Using a 44.1 kHz sampling frequency and a 2048 samples FFT size, the spectral resolution is 21.5 Hz, sharp enough for determining if the speaker bass rendering is good.
I insist on the fact that SpectraLab4.32 configured this way, is continuously working in realtime as soon as you click the "Run" (top left) icon. SpectraLab4.32 updates the PC screen several times per second, enabling to see what's happening to the frequency response curve and phase curve, as soon as you move the mike, move the speaker, re-orient the tweeter, add some mechanical offset to the tweeter, etc.
As soon as the speaker and/or DSP software is okay, doing what it is intended for, you may rely on REW, configuring REW (menu AnalysisPreferences - you must reed this thoroughly) for REW to deliver a frequency response and a phase response that are consistent with what SpectraLab says.
https://www.roomeqwizard.com/help/help_en-GB/html/analysis.html
REW is a powerful analyzer beautifully engineered, sending a couple of SineSweep signals in a row, averaging the response from the speaker, then making smart computations for displaying a lot of useful curves arranged in numerous tabs. One can ask for a new measurement by clicking the "Measure" (top left) icon. You shall look at the harmonic distortion curves up to the 10th harmonic, that are coming fee of charge thanks to Farina's remarkable work. And, you shall also look to the windowed impulse response and windowed step response that REW has computed (pay attention to the checkboxes over there), that are only meaningful about the speaker, at the condition that room reflections are kept minimal. Please remember that REW is a "Room EQ wizard". Through the impulse response and step response, REW helps you visualizing the short-term behavior of the speaker, and the room reflections coming soon after, progressively dominating the long-term speaker response. Please remember that REW, as measuring software, is not supposed to annihilate the room reflections. Actually it rejects the late room reflections to some extend through the time window, to be configured in the Preferences menu - Preferences - Analysis tab, and the simplified tab that's popping when clicking on the "IR Windows" icon (top mid). With REW, by conducting a 256k audio samples SineSweep (44.1 kHz sampling frequency) taking up to 5.9 second, comes the possibility of getting contaminated by very late room reflections. The adjustable time window enables to put the focus on some time period where it is assumed that the speaker response dominates the room reflections. By clicking on the "IR Windows" icon (top mid), one gets a tab enabling to adjust the time window start and end, and also define what's to be considered as the "zero time" (paramount for getting a phase curve that's exact). By clicking on the "Apply Windows to All" icon, the gain and phase curves get updated.
Playing with this will make you understand why and how REW gain and phase curves, may differ from SpectraLab gain and phase curves. With SpectraLab, the time windows length is always equal to the FFT length. Consequently, room reflections frequencies having a period that's correlated to the FFT length will be exacerbated by SpectraLab.
I deeply regret that SpectraLab doesn't offer the possibility to display the computed impulse response that's at the origin of the displayed gain and phase curve. One could have identified glitches in the impulse response extinction, signature of the room modes that are correlated to the FFT length.
Speaking of distortion, as soon as there is a heavy distortion (say more than 10%), the SpectraLab frequency curve will get biased to some extend. SpectraLab computes in the frequency domain, the out/in value, with the "in" being the white noise signal, and the "out" being the mike signal. Let's concentrate on the 100 Hz signal that's buried into the pink noise signal. The mike will pickup some 100 Hz along with some 200 Hz (2nd-harmonic) and 300 Hz (3rd-harmonic). Whatever the distortion percentage, Spectralab will display the correct 100 Hz gain. Unfortunately, SpectraLab cannot make a difference between some 300 Hz coming from the above distorted 100 Hz, and some 300 Hz that's coming from the 300 Hz that's buried into the pink noise signal. As consequence, the SpectraLab gain curve will exaggerate the 300 Hz gain by approx 1dB (the 10% extra). Provided we know, we can live with that.
Now imagine the room to be noisy. Which means that the mike will pickup some frequency content, that's uncorrelated to the pink noise used as stimulus. You will conclude that again, SpectraLab won't be able to discriminate the room noise, from the speaker response. You are right.
If you whistle while SpectraLab is running, you'll see the response curve developing a high peak at the frequency you are whistling.
Now consider the SpectraLab F4 shortcut, and look the various modalities you can select select what's regarding the "Dual Channel Spectral Function Options" :
- Real Transfer Function
- Cross Spectrum
- Complex Transfer Function
- Coherence Function
- and also Complex Transfer and Coherence on a same page
Impressive! By proper use of the above modalities, by comparing what they tell, and by trying different FFT lengths also, you get help for knowing if your measurement session is clean, or facing heavy distortion, of facing intense room reverberation, of facing intense noise from the room, not to forget a whistler possibly.
As a footnote, I'll say that SpectraLab gain and phase curves earn my preference, as they exhibit the kind of "fine grass" (kind of noise) appreciated by engineers and experts, telling if the underlying measurement session was clean or not.
As you dare dealing with the roots (PCB design hosting a Sharc DSP and various input/outputs, DSP software design), you shall deal with the roots what's regarding audio testing. Please get a decent USB soundcard featuring two line inputs and two line outputs. Let SpectraLab generate the pink noise signal. Use a "T" RCA adapter at the output of the soundcard for connecting 1) a RCA cable wire going to your speaker (analog input required !) and 2) a RCA cable returning to the right audio input (considered as reference). Connect the left audio input to some amplified measurement mike.
Or, possibly, in case you program a pink noise generator in the Sharc DSP, and in case the Sharc DSP can output such pink noise signal in analog form, you may let SpectraLab work in a passive way, not in charge of outputting the pink noise signal. SpectraLab will grab both audio signals (reference and mike), and will work just as usual.
Attachments
Last edited:
It's very cool. I love to see self-made multi-way system like you.
My limitted understanding is that you designed PCB having DSP for digital crossover and calculated coefficient,finally fixed up.English is not my mother tongue,not easy to read large quantity. 🙂
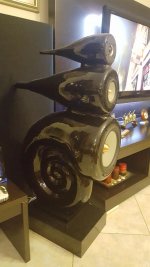
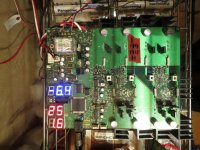
I'm very interested in your project because I also did the same thing like you.Mine is FPGA-based transport which read digital data from onboard SDcard and 8pcs DAC with digital crossover and poweramp.My system is 4-way.I need 4pcs amp per channel.
FPGA-based doesn't have expandability because of limitted resource,is fully dedicated to my personal use.On the other hand,its simplicity is advantage, easy to operate by batteries. Appearence is somewhat wild compared with you.😱
Photos are transport,DAC and room which also I built by myself.
My limitted understanding is that you designed PCB having DSP for digital crossover and calculated coefficient,finally fixed up.English is not my mother tongue,not easy to read large quantity. 🙂
I'm very interested in your project because I also did the same thing like you.Mine is FPGA-based transport which read digital data from onboard SDcard and 8pcs DAC with digital crossover and poweramp.My system is 4-way.I need 4pcs amp per channel.
FPGA-based doesn't have expandability because of limitted resource,is fully dedicated to my personal use.On the other hand,its simplicity is advantage, easy to operate by batteries. Appearence is somewhat wild compared with you.😱
Photos are transport,DAC and room which also I built by myself.
Attachments

It's very cool. I love to see self-made multi-way system like you.
My limitted understanding is that you designed PCB having DSP for digital crossover and calculated coefficient,finally fixed up.English is not my mother tongue,not easy to read large quantity. 🙂
I'm very interested in your project because I also did the same thing like you.Mine is FPGA-based transport which read digital data from onboard SDcard and 8pcs DAC with digital crossover and poweramp.My system is 4-way.I need 4pcs amp per channel.
FPGA-based doesn't have expandability because of limitted resource,is fully dedicated to my personal use.On the other hand,its simplicity is advantage, easy to operate by batteries. Appearence is somewhat wild compared with you.😱
Photos are transport,DAC and room which also I built by myself.
Wow!
Can you share source documents for your solution? I'm fascinated by FPGA-based audio DSP design. Just don't see it much at all.
Your listening room is also pretty wild!
Yes,I live at wild area.The other day an owl collided against my window and fainted for a while before flew away without noise.My avator is that owl.
What you want to do in audio DSP is almost same,LPF,BPF,HPF,delay adjustment and so on.The difference is which device,CPU,DSP and FPGA ,you use to implement.FPGA is the most hardware-oriented,relatively not familiar.FPGA programming can be done by C now.Obstacle is that I think you can't find suitable prototype like OpenDRC,MiniDSP,Ras-pi,BBB.
I use XC7A100T(Artix7) which has configurable 512k byte memory.Maximum taps for digital filters you can get from FPGA depend on this internal memory.It's simple equation if you use 4k tap with 32bit signal max available are 512k/(4k*4)=32pcs.This is on conditions with 96kHz/32bit.if 48kHz/32bit,you can get double.if 192kHz/32bit,half.
This is of cource real time calculation at 100MHz FPGA internal clock(moderate for Artix7,200MHz is probably possible at the cost of power dissipation).XC7A100T is $130(digi-key).I think this is comparable price with other solutions.You basically need SDcard,FPGA and ARM(cortex3) like photo I posted before.FPGA has potential for audioDSP.
correction
A little correction about the equation.
512k/(4k*4)=32pcs is available at 200Mhz clock and linear phase filter,which means coefficient is half(2k).If not linear phase,(512k/(4k*4))/2=16pcs.
if 2k tap,512k/(2k*4)=64pcs is available at 100Mhz clock and linear phase filter,which means coefficient is half(1k).If not linear phase,(512k/(2k*4))/2=32pcs.
if 1k tap,512k/(1k*4)=128pcs is available at 100Mhz clock regardless of linear phase or not.I usually use 1k tap.It's almost sufficient for various FIR in my experience.
- Status
- Not open for further replies.
- Home
- Source & Line
- Digital Line Level
- My new minisharc dsp audio preamplifier/crossover project