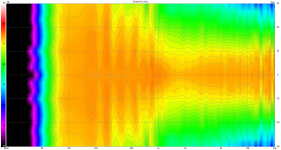
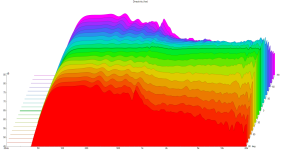
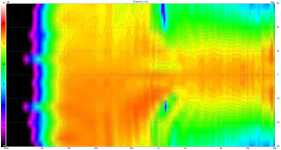
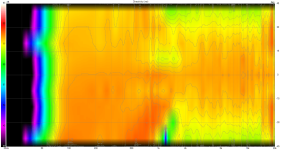
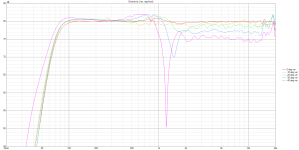
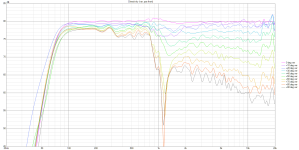
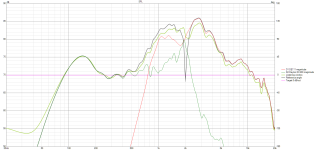
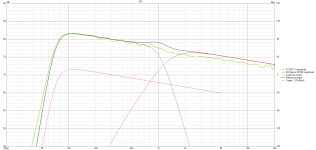
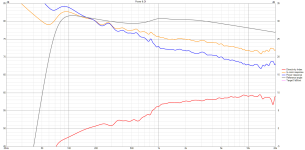
This is my first attempt at designing a 2-way crossover and I don't know if I did it correctly. Please offer advice on errors or better crossover strategies. It isn't passive because I don't have proper testing equipment, passive components, or any experience working with passive crossovers. My intent is to put this crossover into Equalizer APO so I can see what it sounds like before trying to design a passive version.
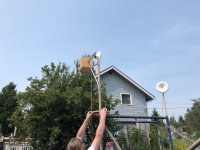
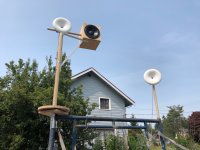
I used VituixCAD but I didn't have an XLR mic with external sound card. I had to measure using a USB microphone and REW's "Use Acoustic Timing Reference" option. Measurements were taken outside on a 7 foot scaffolding with a 3 foot extension on a turntable = 10 feet total. The photos are vertical measurements, with the acoustic timing source to the right of the measured 2-way speaker.
This is a freestanding ATH waveguide speaker: 46 degree half angle, 8.7 inches (222mm) axisymmetric, B&C DE111 compression driver. Waveguide can be lowered and raised to adjust center to center distance. It can also be moved forward. At present, it is flush with the front of the woofer box which is a 9x9 inch (228 mm) O.D. cube with an 8 inch Dayton DC200-8 classic woofer. I cut off the low end output of the woofer just to prevent confusion from the lower frequency measurements. I'll eliminate the LF cutoff from the APO crossover and let the woofer naturally roll off to wherever it decides to go. Woofer box is closed, no port.
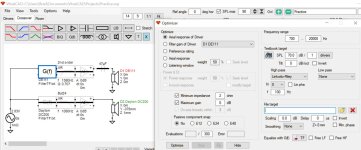
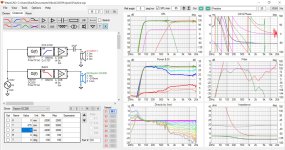
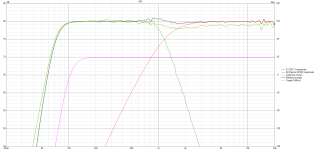
My design process was to 1) smooth both driver responses to 12 dB then use Optimizer "Axial Response of Driver" to create a transfer function file to flatten each driver, 2) add the amplifiers, and 2) add a 47uf capacitor in front of the tweeter as protection against accidentally sending full signal.
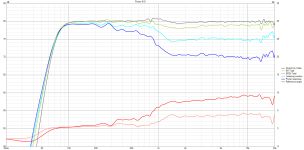
My REW measurements did not reach 80dB across all frequencies so I flattened them to 70dB then raised them to 80dB in the Drivers tab to make it easier to see the report results. I don't know if that was the right way to do it. Further, the woofer was measured at -10dB in REW and I reduced the tweeter to -20dB because the tweeter was way too loud to shoot around the neighborhood. Same amplifier level but lower dB in REW.
Please let me know if you see any red flags with my measurement and crossover process that destroyed any chance of getting a useful simulation from VituixCAD, thank you. I have included the VCAD files in a Zip folder. I can supply the original ungated REW file measurements if it will help. Also, I did not do a near field measurement/merge of the woofer because I was only interested in learning how to use the program. I don't know if that ruined the crossover design process. Thanks


Attachments
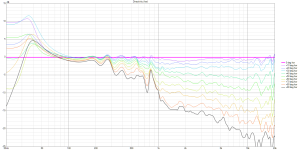
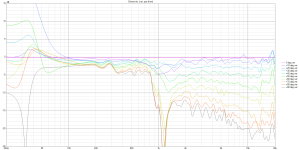
The frequency response graphs look too flat to me, the only time my measurements are that flat is when I overdrive the microphone. When this happens I will discard the measurements, adjust the gain and try again. I'm probably wrong and you drivers and measurement setup are just better than mine. Your impedance graph also looks flat, this won't matter with active crossover but won't work for a passive design.
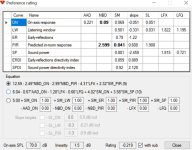
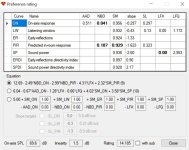
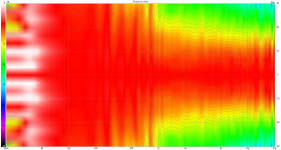
If you use the "view preference rating" feature you will see that a smoothly sloping in-room response combined with a flat axial response maximizes pref rating. In fact, its better to have small "bumps" on the axial response than on the in-room response.
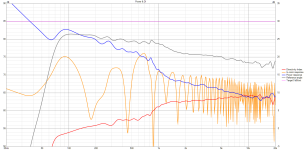
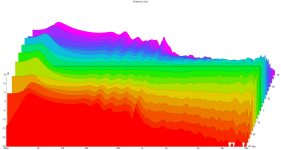
My main criticism of yours is the sharpness of the transition between woofer and tweeter as seen in the power response. You may be able to smooth this out by tuning the vertical spacing between drivers. You should certainly view the in-room response curve and its smoothness while doing this.
I've had best luck using LRx filters. It can help smoothness to have some overlap between the HPF and LPF cutoff frequencies.
I missed that part, the raw measurements look more realistic. It does seem lot a lot of EQ to get them that flat.
I'm learning how to use VituixCAD so I'm including these images to help anyone else in my shoes.
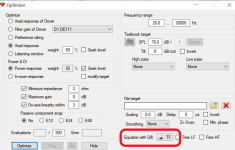
This is the button you use to create the transfer function EQ
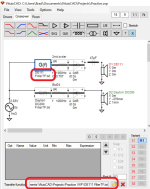
After you generate it and choose the file location, you should see the file listed in your TFF block and in the TFF block details like this. Also, notice the blocks following the TFF block are "shorted". If they aren't shorted they will be included in the transfer function file. Which you may or may not want. I didn't want them included because I wanted to apply crossovers on flattened drivers.
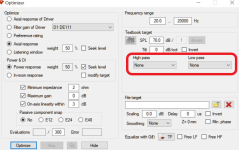
Also, after you work out your crossovers, you can delete the file from the TFF block with the red X in the details section of the block. Then use Optimizer to create a new TFF but include the crossover slopes/frequencies you decided worked best inside the Optimizer window.
After all of that, you can use View > Impulse Response to export a WAV file to import into Equalizer APO. However, I might just export the flat Driver file (don't include the crossovers) and add the crossovers using Equalizer APO so that I can quickly change them and listen to the difference.
This is the button you use to create the transfer function EQ

After you generate it and choose the file location, you should see the file listed in your TFF block and in the TFF block details like this. Also, notice the blocks following the TFF block are "shorted". If they aren't shorted they will be included in the transfer function file. Which you may or may not want. I didn't want them included because I wanted to apply crossovers on flattened drivers.

Also, after you work out your crossovers, you can delete the file from the TFF block with the red X in the details section of the block. Then use Optimizer to create a new TFF but include the crossover slopes/frequencies you decided worked best inside the Optimizer window.

After all of that, you can use View > Impulse Response to export a WAV file to import into Equalizer APO. However, I might just export the flat Driver file (don't include the crossovers) and add the crossovers using Equalizer APO so that I can quickly change them and listen to the difference.
Last edited:
There is definitely a learning curve on Vituix and the help files are not tutorials.
Re' my earlier comments:
right click in the middle (Power and DI) graph and check "Show In-room response". This will show up as an orange curve. Its the one that should have the downward tilting response while the axial response remains flat.
In the top left corner of the main screen, click on view. In the pop up, you can select to view either or both impulse response and preference rating.
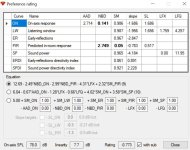
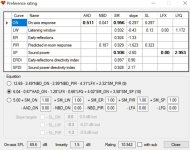
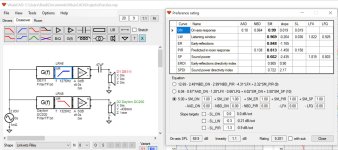
The preference rating is a weighted sum of the curves in the white background part of the preference screen. I click the 3rd circle below that white background table and use the default weights to get a rough idea of the designs pref rating, which is shown at the very bottom of that window. A more experienced designer might adjust the weights so the rating agrees with what his ears him but I think the defaults are close enough for this purpose
do you have reflections enabled in the room tab? turn them off for evaluating the smoothness and roll off of the room curve
Ok, now I'm starting to understand what you meant by adjusting the crossovers while looking at the preference rating. It automatically updates so you can see if you've made an improvement. Except it will take time to get a feel for the individual numbers. I need to read the help file to find out why some are bold.
Here is a LR8 1275/1325 - Tweeter Woofer center-to-center = 438 mm (17.244 inches)
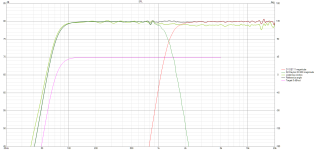
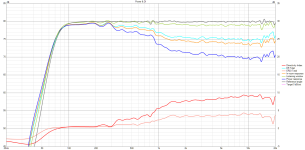
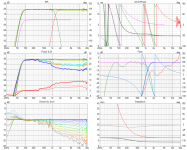

Here is a LR8 1275/1325 - Tweeter Woofer center-to-center = 438 mm (17.244 inches)


getting there...
you can look at threads by hifijim and vineeth kumar to see examples of 2-ways using vituix
you can look at threads by hifijim and vineeth kumar to see examples of 2-ways using vituix
because it give me a higher numbr 🙂 I haven't the experience to judge its reliability.. this eqn serves as a metric until I can listen.
generally its highest when you have a flat axial response and a smoothly falling power response and predicted in-room response, and sufficiently extended bass response. If you play with it, you will see that it rewards you for smoothing that PIR at the expense of the axial FR, but only up to a point. That shouldn't be surprising because its the actual in-room response that we listen to.
generally its highest when you have a flat axial response and a smoothly falling power response and predicted in-room response, and sufficiently extended bass response. If you play with it, you will see that it rewards you for smoothing that PIR at the expense of the axial FR, but only up to a point. That shouldn't be surprising because its the actual in-room response that we listen to.
🤣 I respect your motivation. Also, "rewards you for smoothing that PIR at the expense of the axial FR, but only up to a point" sounds like good advice for passive crossovers. I haven't run into that dilemma because I'm only able to do active crossovers right now. I'd like to build passive crossovers so I will remember your advice when I do. Thanks for all your help. It made a big difference getting me through the initial VituixCAD learning barrier. 👍
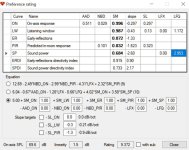
I don't trust the higher numbers for my 2-way. I'm less suspect of the lower preference ratings. But I found out I could lower the score on Equation 9 by adding a sub. I never measured and merged the woofer's low frequency output so it must have confused the PR score calculation. I'll need to buy the measuring equipment so I can build passives.
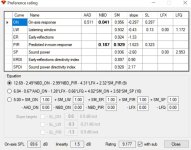
I don't trust the higher numbers for my 2-way. I'm less suspect of the lower preference ratings. But I found out I could lower the score on Equation 9 by adding a sub. I never measured and merged the woofer's low frequency output so it must have confused the PR score calculation. I'll need to buy the measuring equipment so I can build passives.

what is good advice for passives is good for actives; you need to buy measuring equipment for actives too
Member
Joined 2003
3rd equation exists specifically for use with optimizer,in order to direct the optimizer results, you will find some description along these lines in the help file.
It's nice to see someone utilizing the transfer function block and impulse response convolution. It can be quite a powerful tool to develop active crossover using a PC as the DSP. You may have already found, but the frequency range and target slope should be carefully selected to avoid over-correcting the natural driver rolloff at low frequencies for example. As well, it can be useful to apply some smoothing to the driver response to avoid over-correcting every small little wiggle. Just use the smoothing options in the driver tab for this.
Your photos in the OP are a bit confusing, but the most important part of using acoustic timing reference is that the distance from the acoustic reference to the mic must remain constant for all measurements. This can be a bit challenging when moving from measuring the woofer response set to the tweeter response set, to keep precise distance from mic to reference. If you continue with further speaker designs, I would highly recommend XLR mic for electrical timing reference, you will find it a lot easier and reliable than the acoustic reference.
Also, by all means continue with near field and merge process, it's just 1 more measurement and a diffraction simulation, easily done to complete the woofer response.
Last edited:
- Home
- Loudspeakers
- Multi-Way
- My First Crossover, 2-Way w/ VituixCAD
